
Report
Presented by

Founder Salary Report 2026

Presented by
Key insights

Founder pay in 2026

  • Founder salaries are recovering from historic lows. The average jumped from $98K in 2025 to $118K this year.
  • Growth is the strongest signal. Revenue and team size are the strongest predictors of founder earnings.
  • Benchmarking boosts founder salaries. Founders who benchmark against market rates earn more than those who base it solely on runway.
  • Clarity is the edge. Knowing your finances gives you the confidence to pay yourself what you're worth.

What should you pay yourself?

As a founder, you’re building something real, and you deserve to be paid like it. But between runway math, hiring plans, and the pressure to grow, paying yourself often ends up last on the list. There's no silver bullet number that works across every business, but we've created this report year after year to give founders a starting point.

Now in its sixth year, Pilot's Founder Salary Report aggregates real data from 1,600+ founders to find out what they're paying themselves and the factors to weigh as you determine the right number for you.

Salary overview

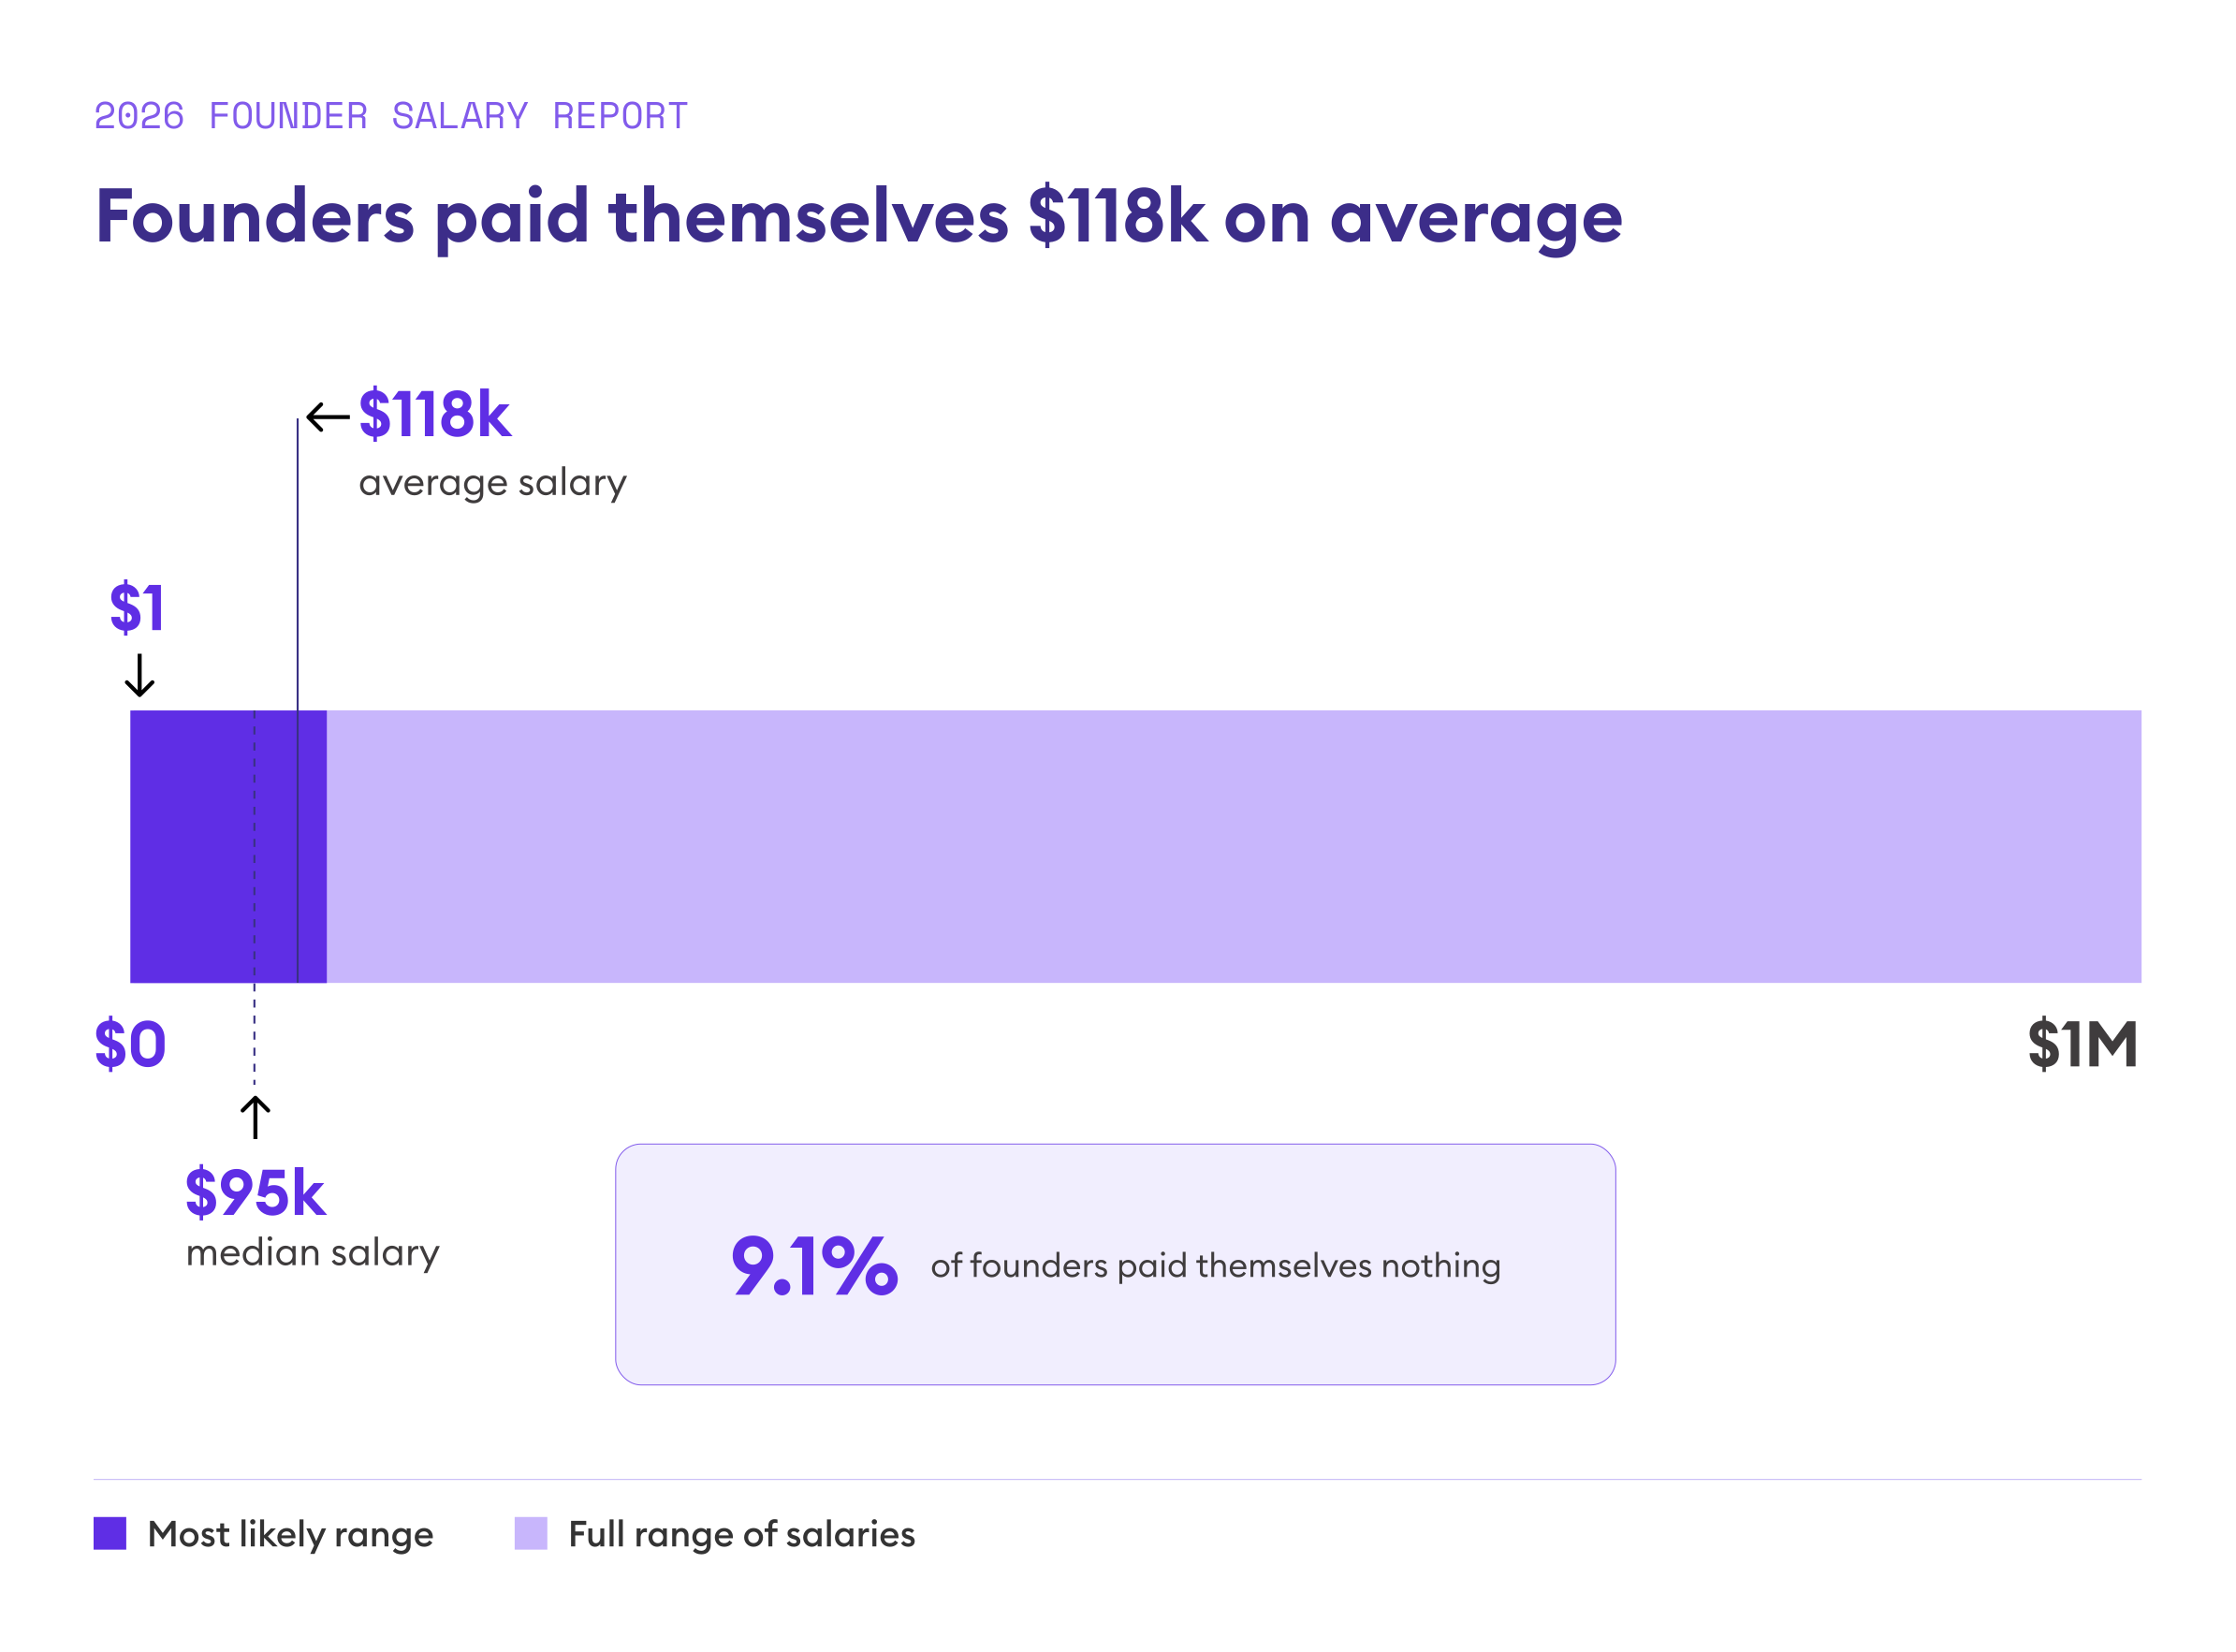
Founders pay themselves an average of $118K

In this year's survey, founders paid themselves an average of $118K. And at the other end: 9.1% of founders paid themselves nothing, up from 5.4% in 2025.
Salaries have stabilized after historic lows

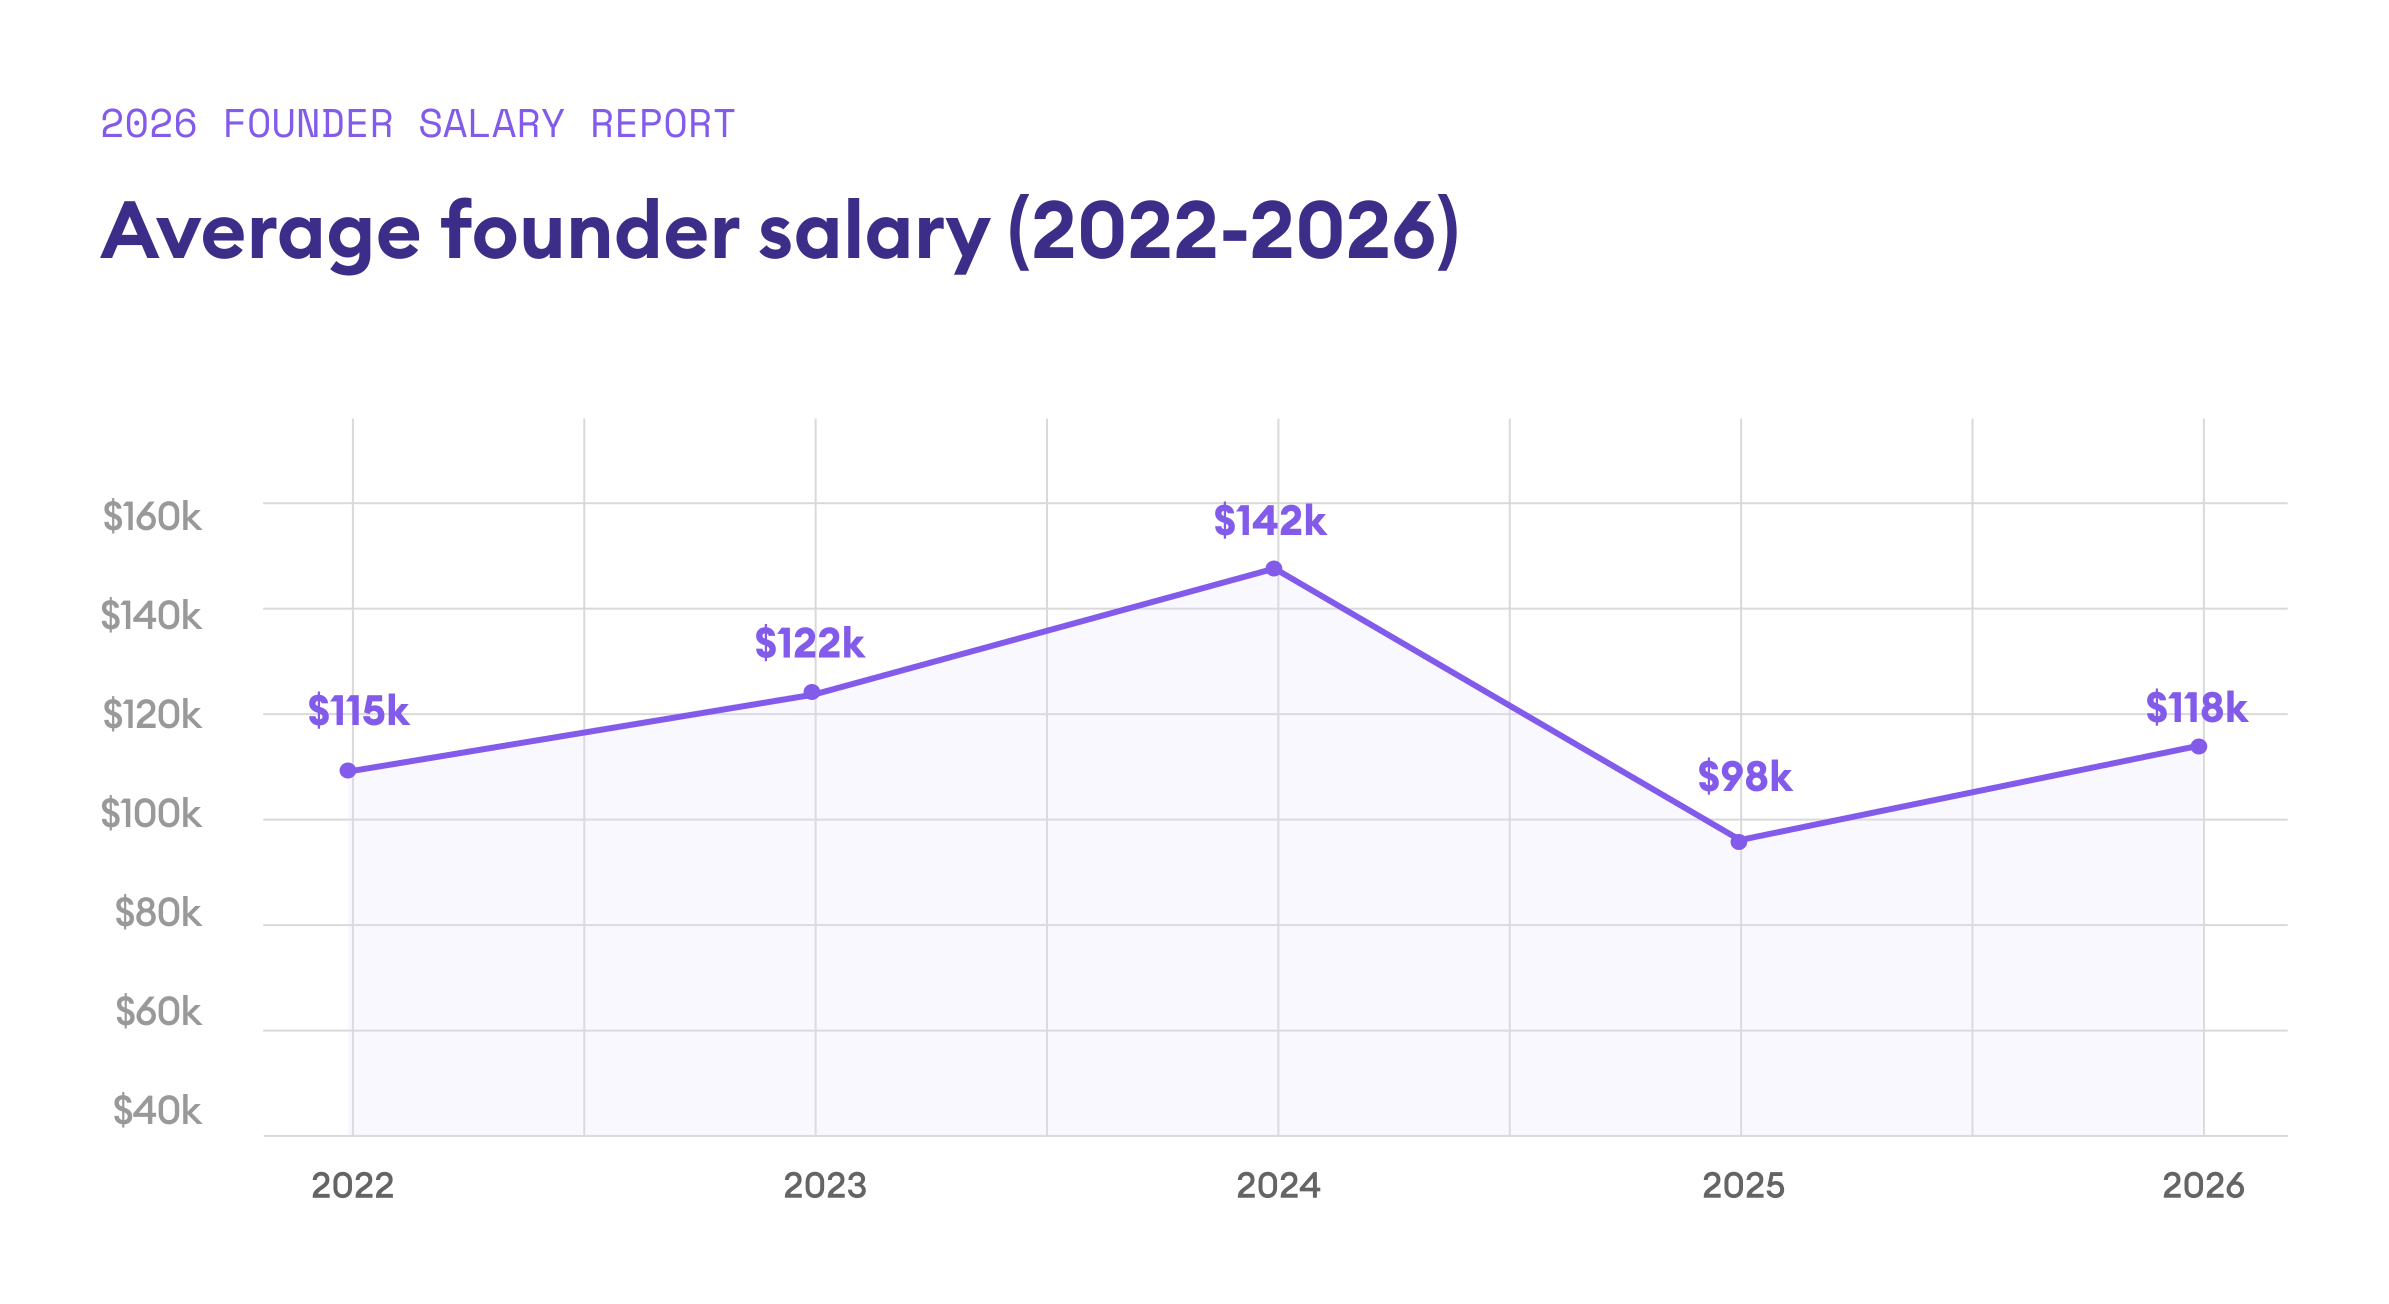
After peaking at $142K in 2024, the average founder salary fell 31% to $98K in 2025. This year's $118K average marks a meaningful recovery but remains 17% below the peak two years ago.
Most founders have another income source

Seventy-seven percent of founders rely on at least one other source of income aside from their salary, whether that's investments, a spouse’s earnings, savings, or consulting. For those taking little or no salary, that safety net likely makes it possible.
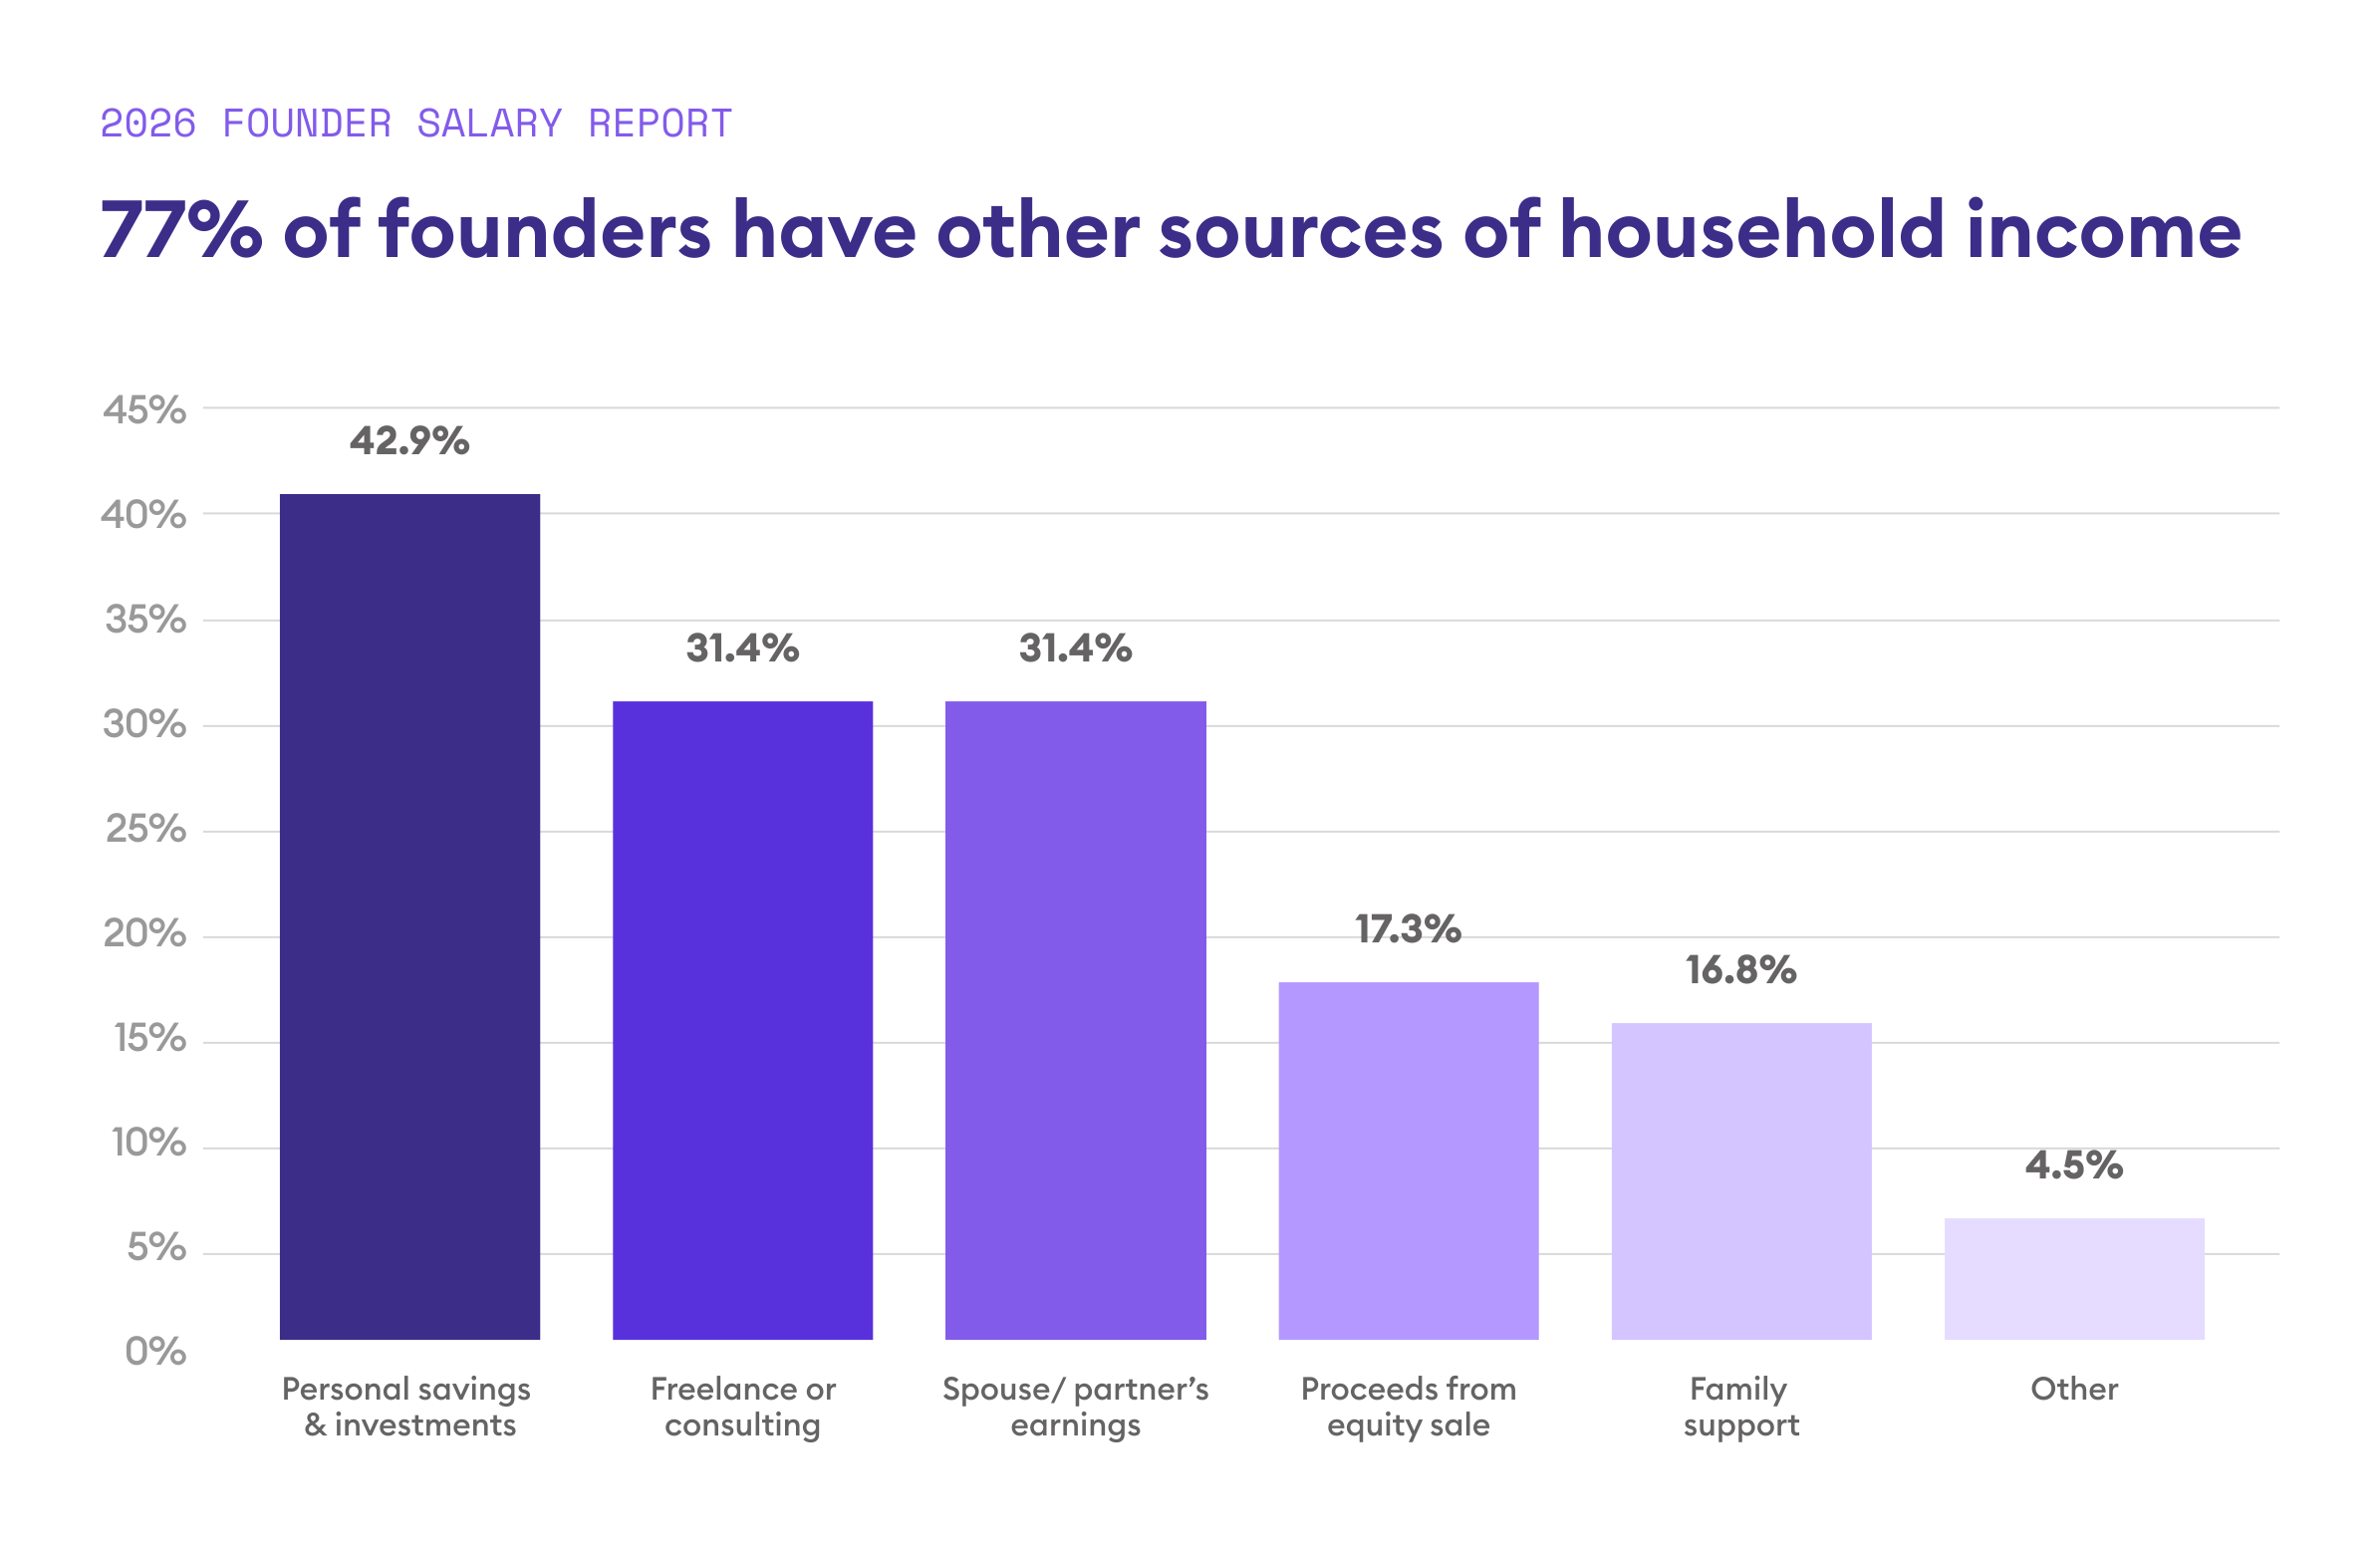
*Multi-select respondents can appear in multiple groups, so percentages sum to more than 100%.

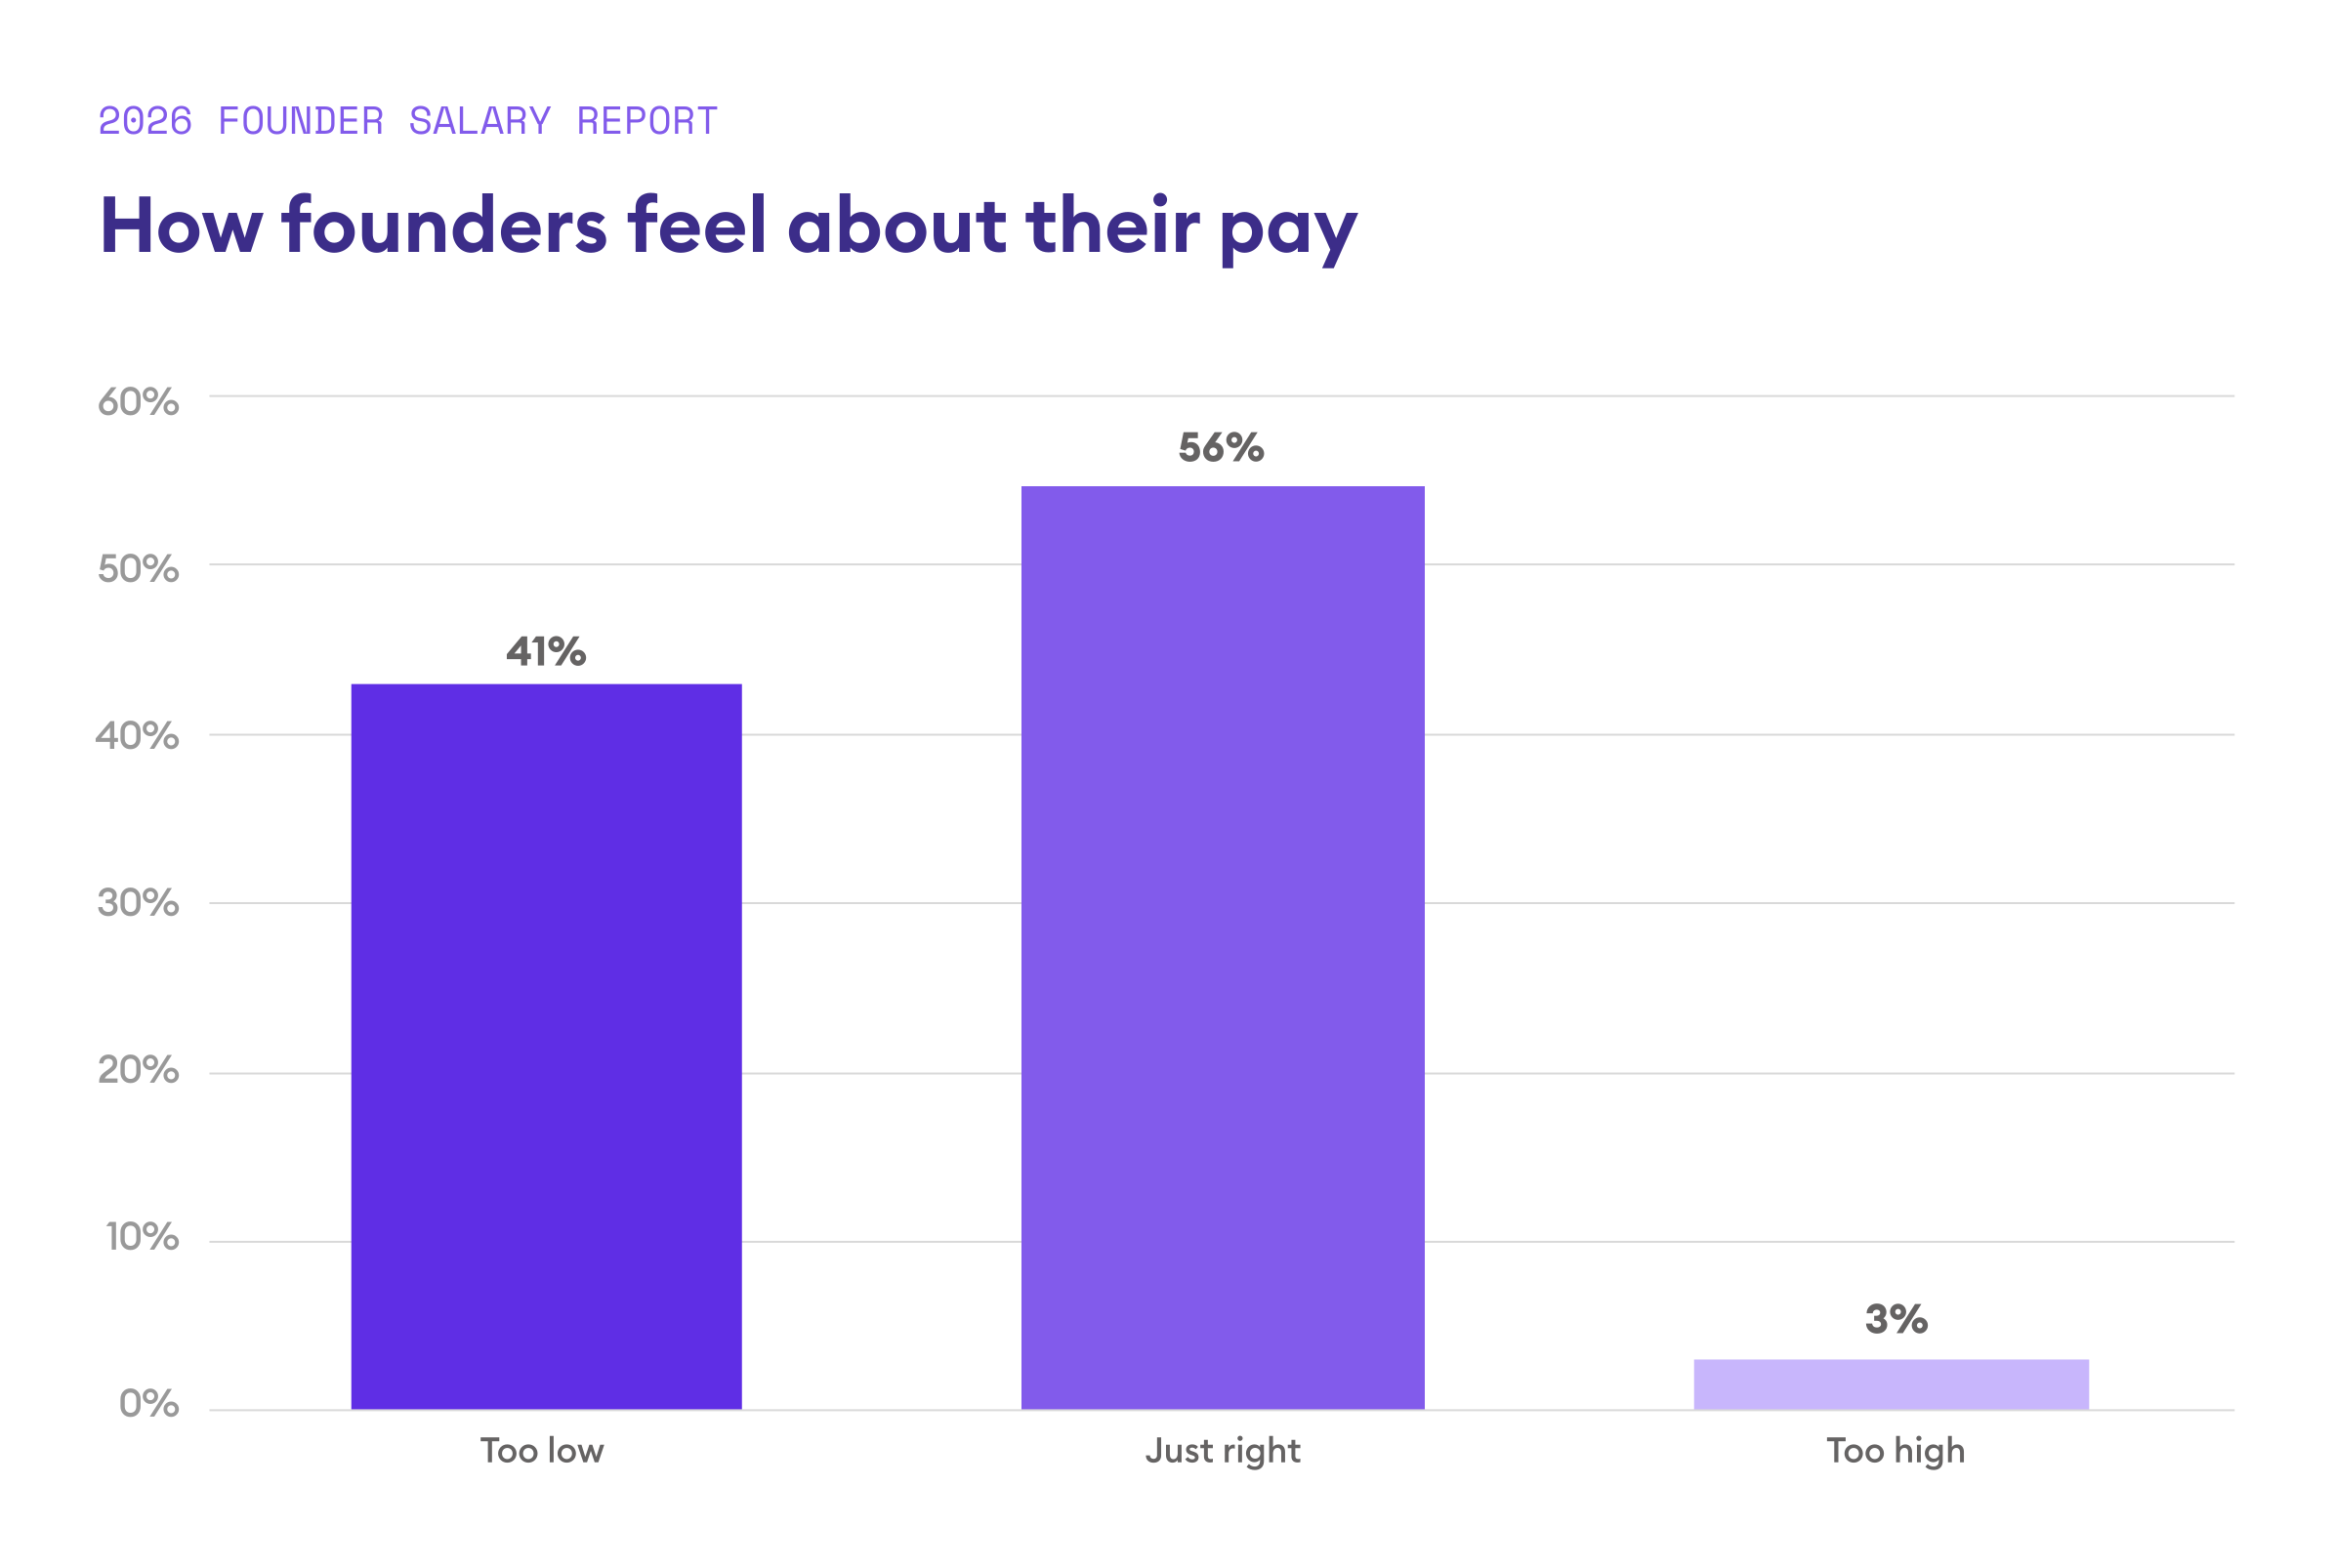
Nearly half of founders feel underpaid

Forty-one percent of founders feel underpaid. Those who feel underpaid earn less than those who feel fairly paid. Only 3% feel they're paid too much.  
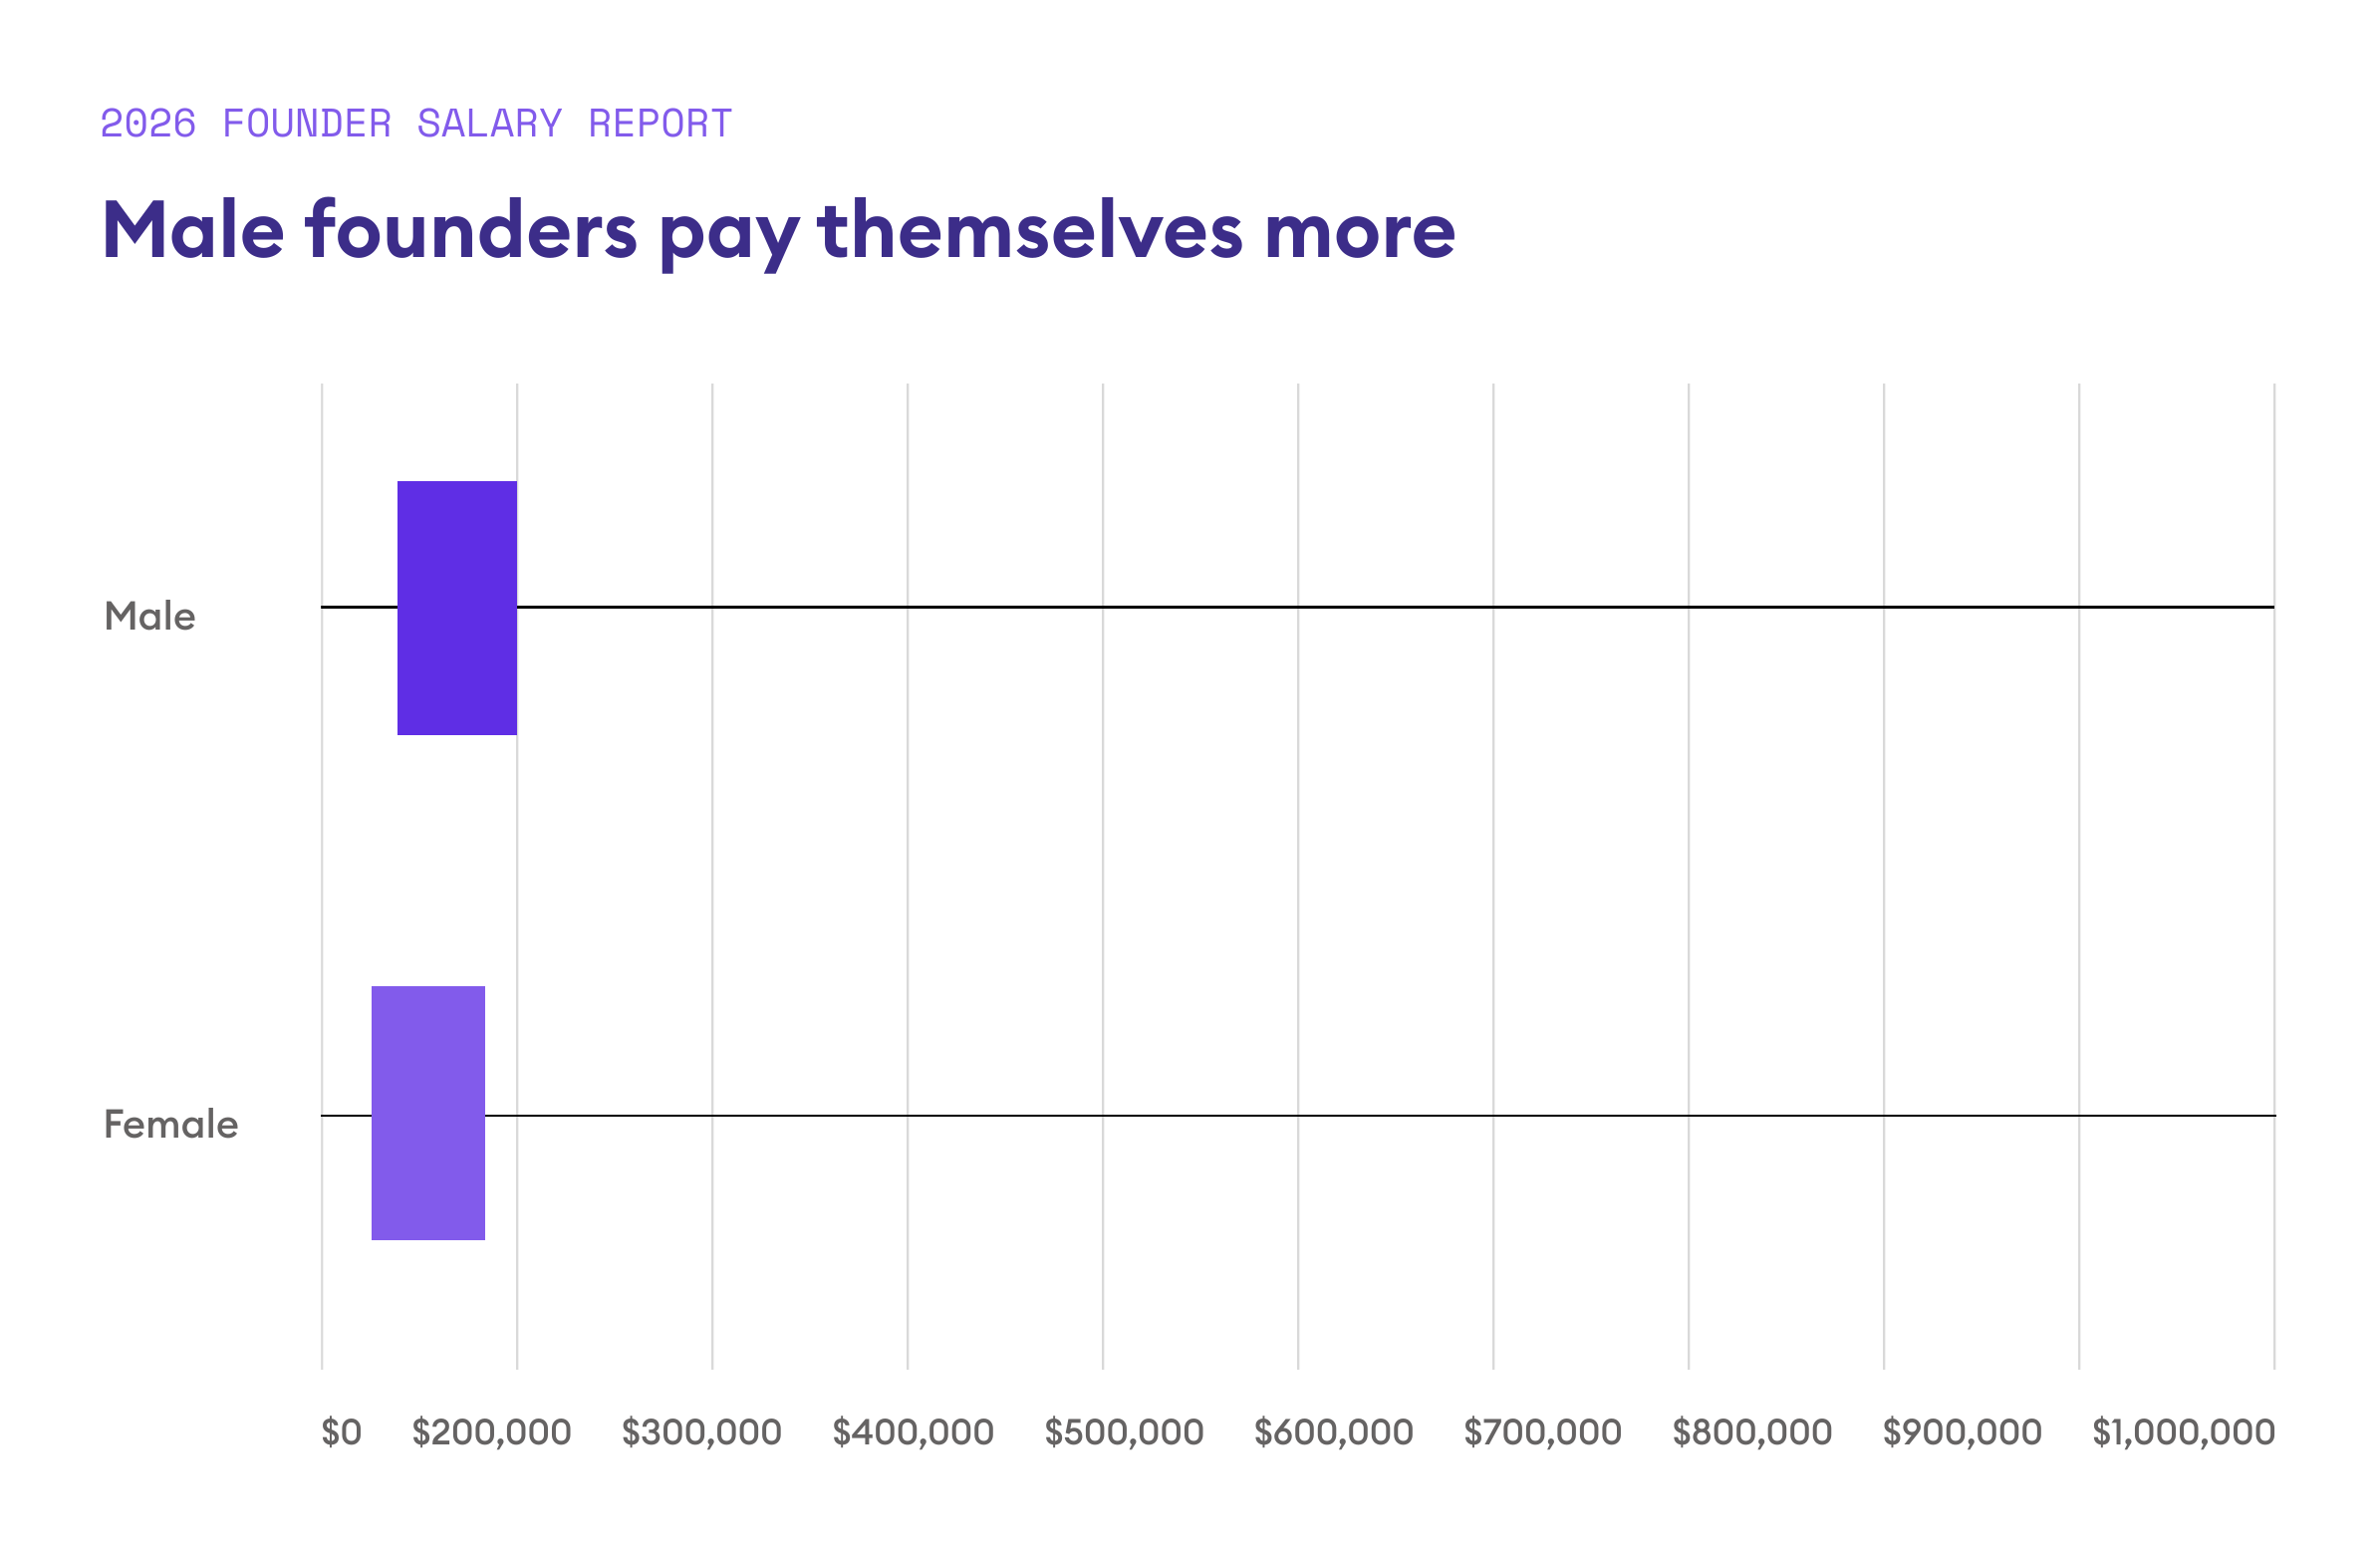
Male founders pay themselves more

Male founders tend to pay themselves more than their female counterparts, taking in an average of 16.5% more.
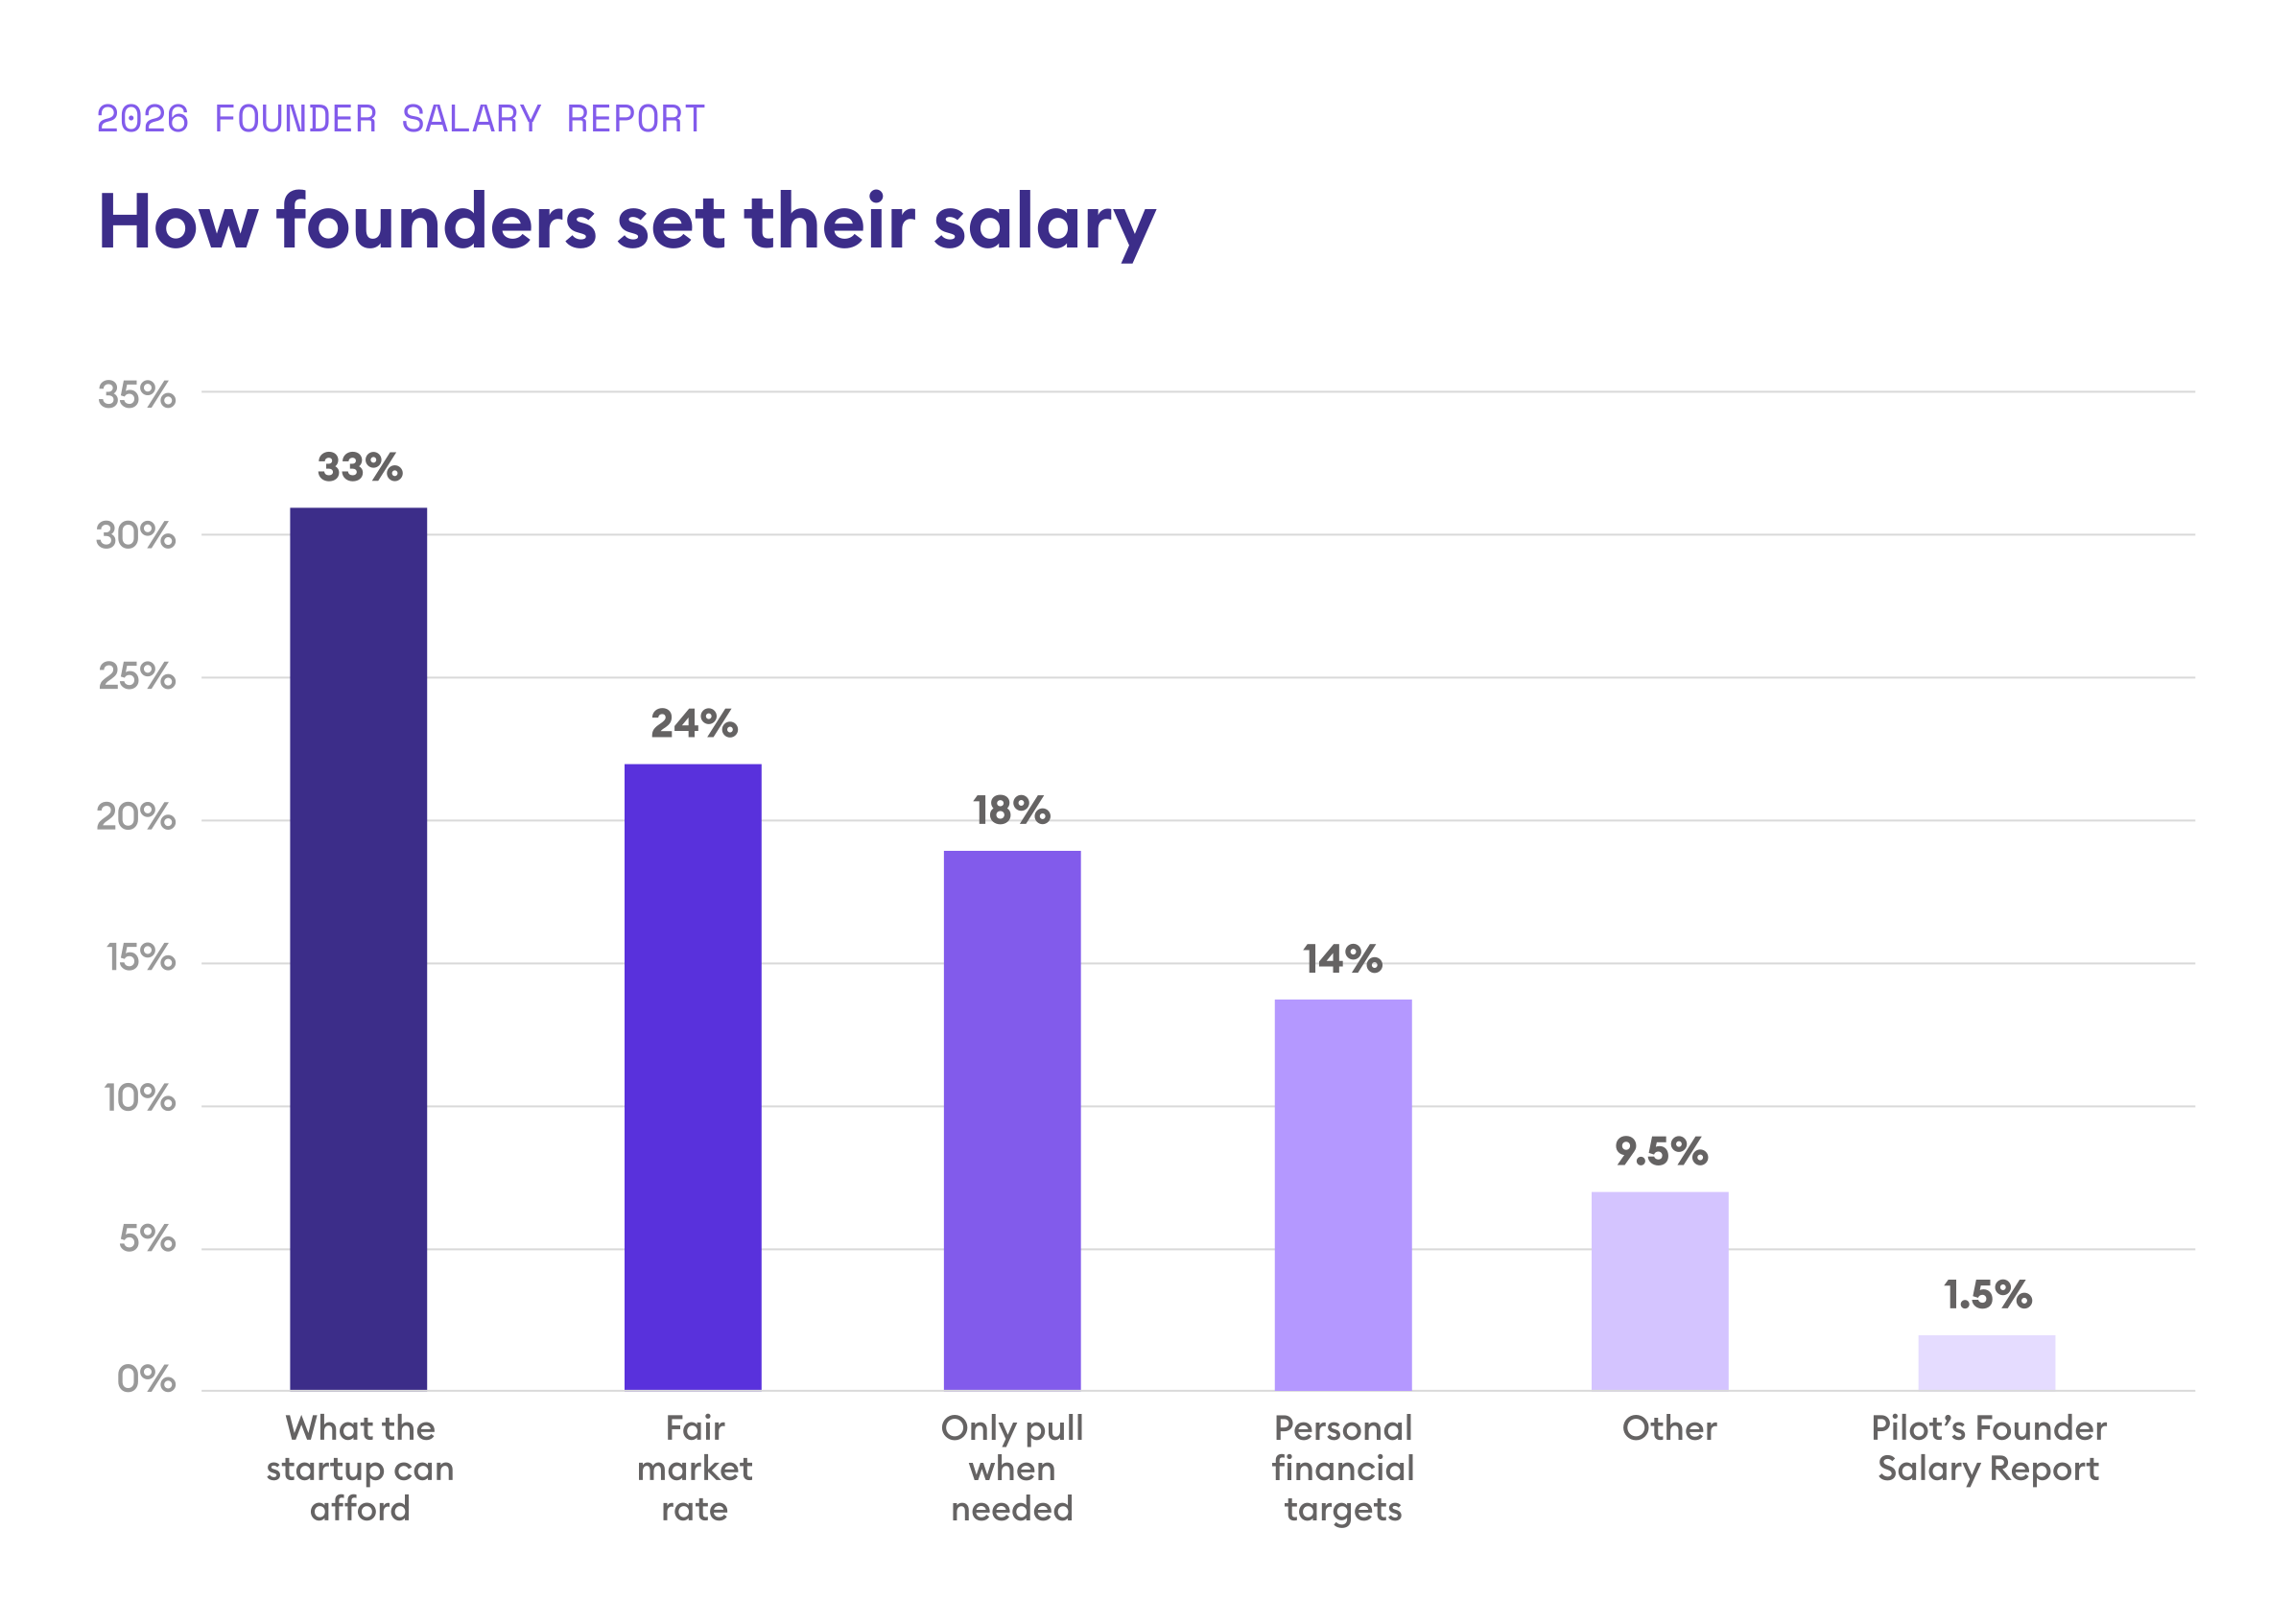
Founders often look to the business for answers

While there are many ways to determine salary, 1 in 3 founders set their salary based on what the startup can afford. This approach anchors your pay to what's left in the account rather than your financial position.
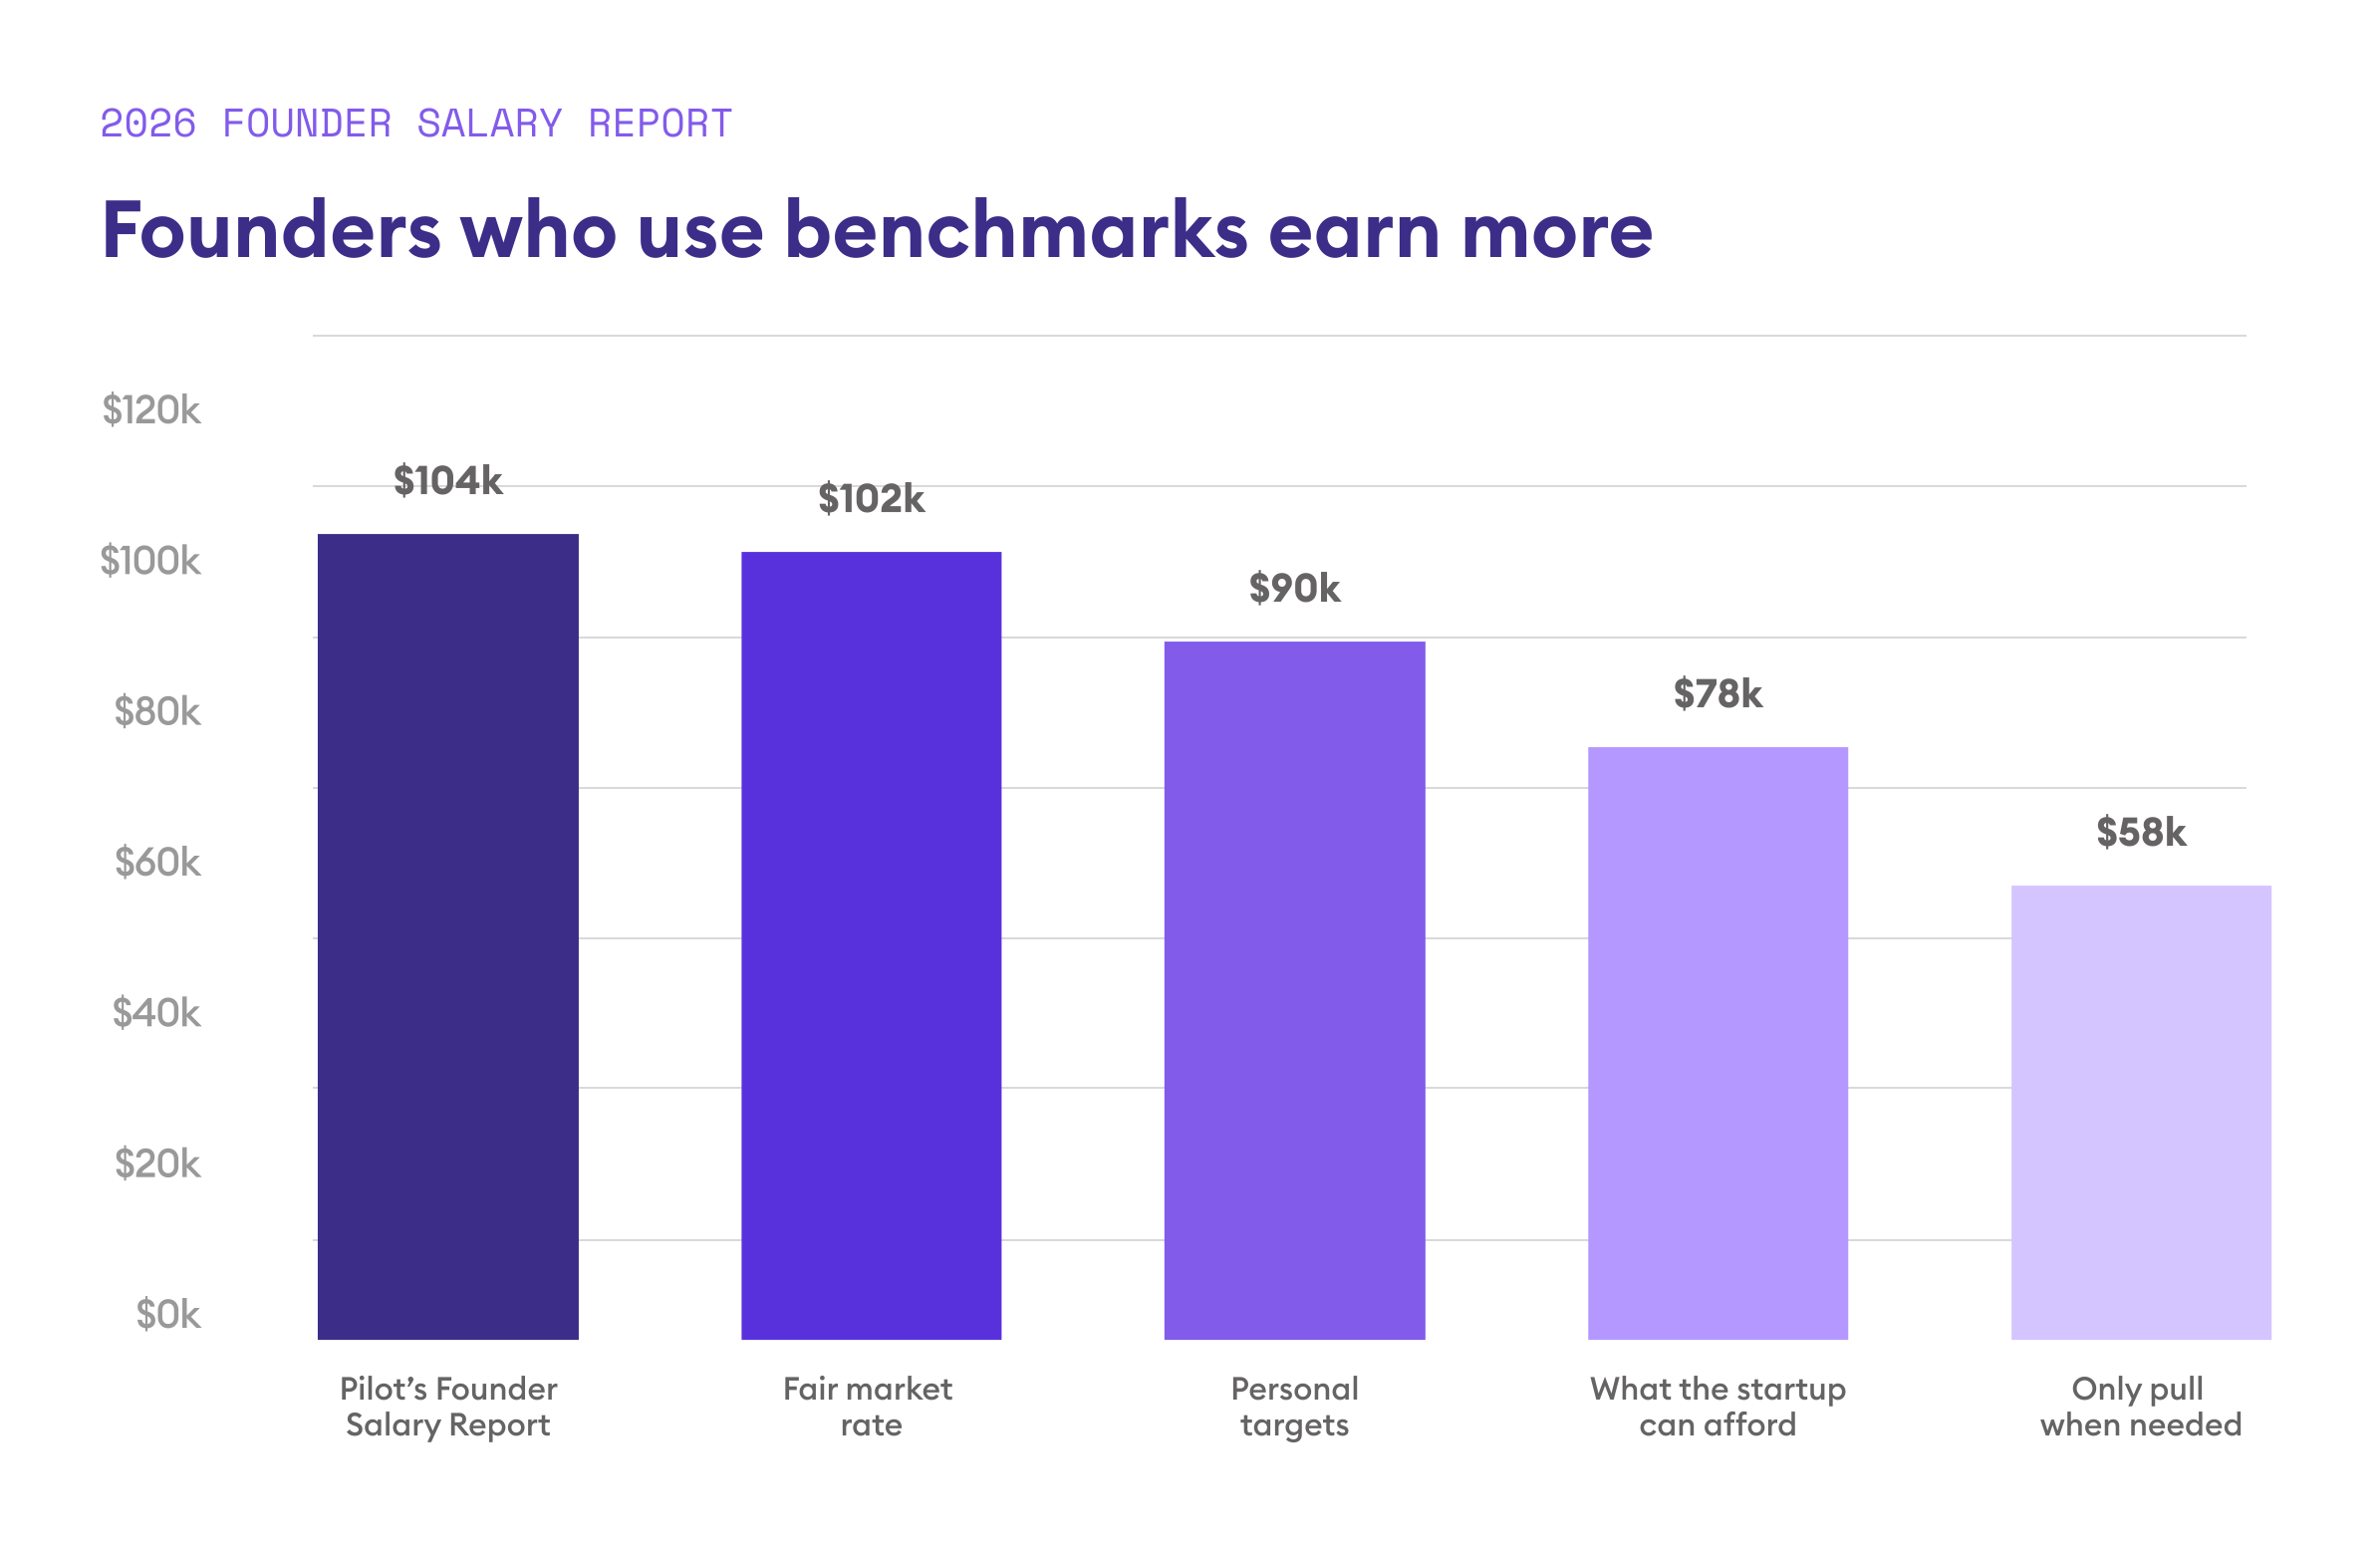
Founders who use benchmarks earn more

Founders who benchmark against fair market rates consistently pay themselves more—an average of $102K compared to $79K for those who base it on what the startup can afford.
OUR TAKE
Paying yourself well takes two things: knowing what the market pays, and knowing your own numbers well enough to act on them. The founders who benchmark against fair market rates and build their business from a clear financial foundation often make more.
Salaries by funding

Average funding dropped

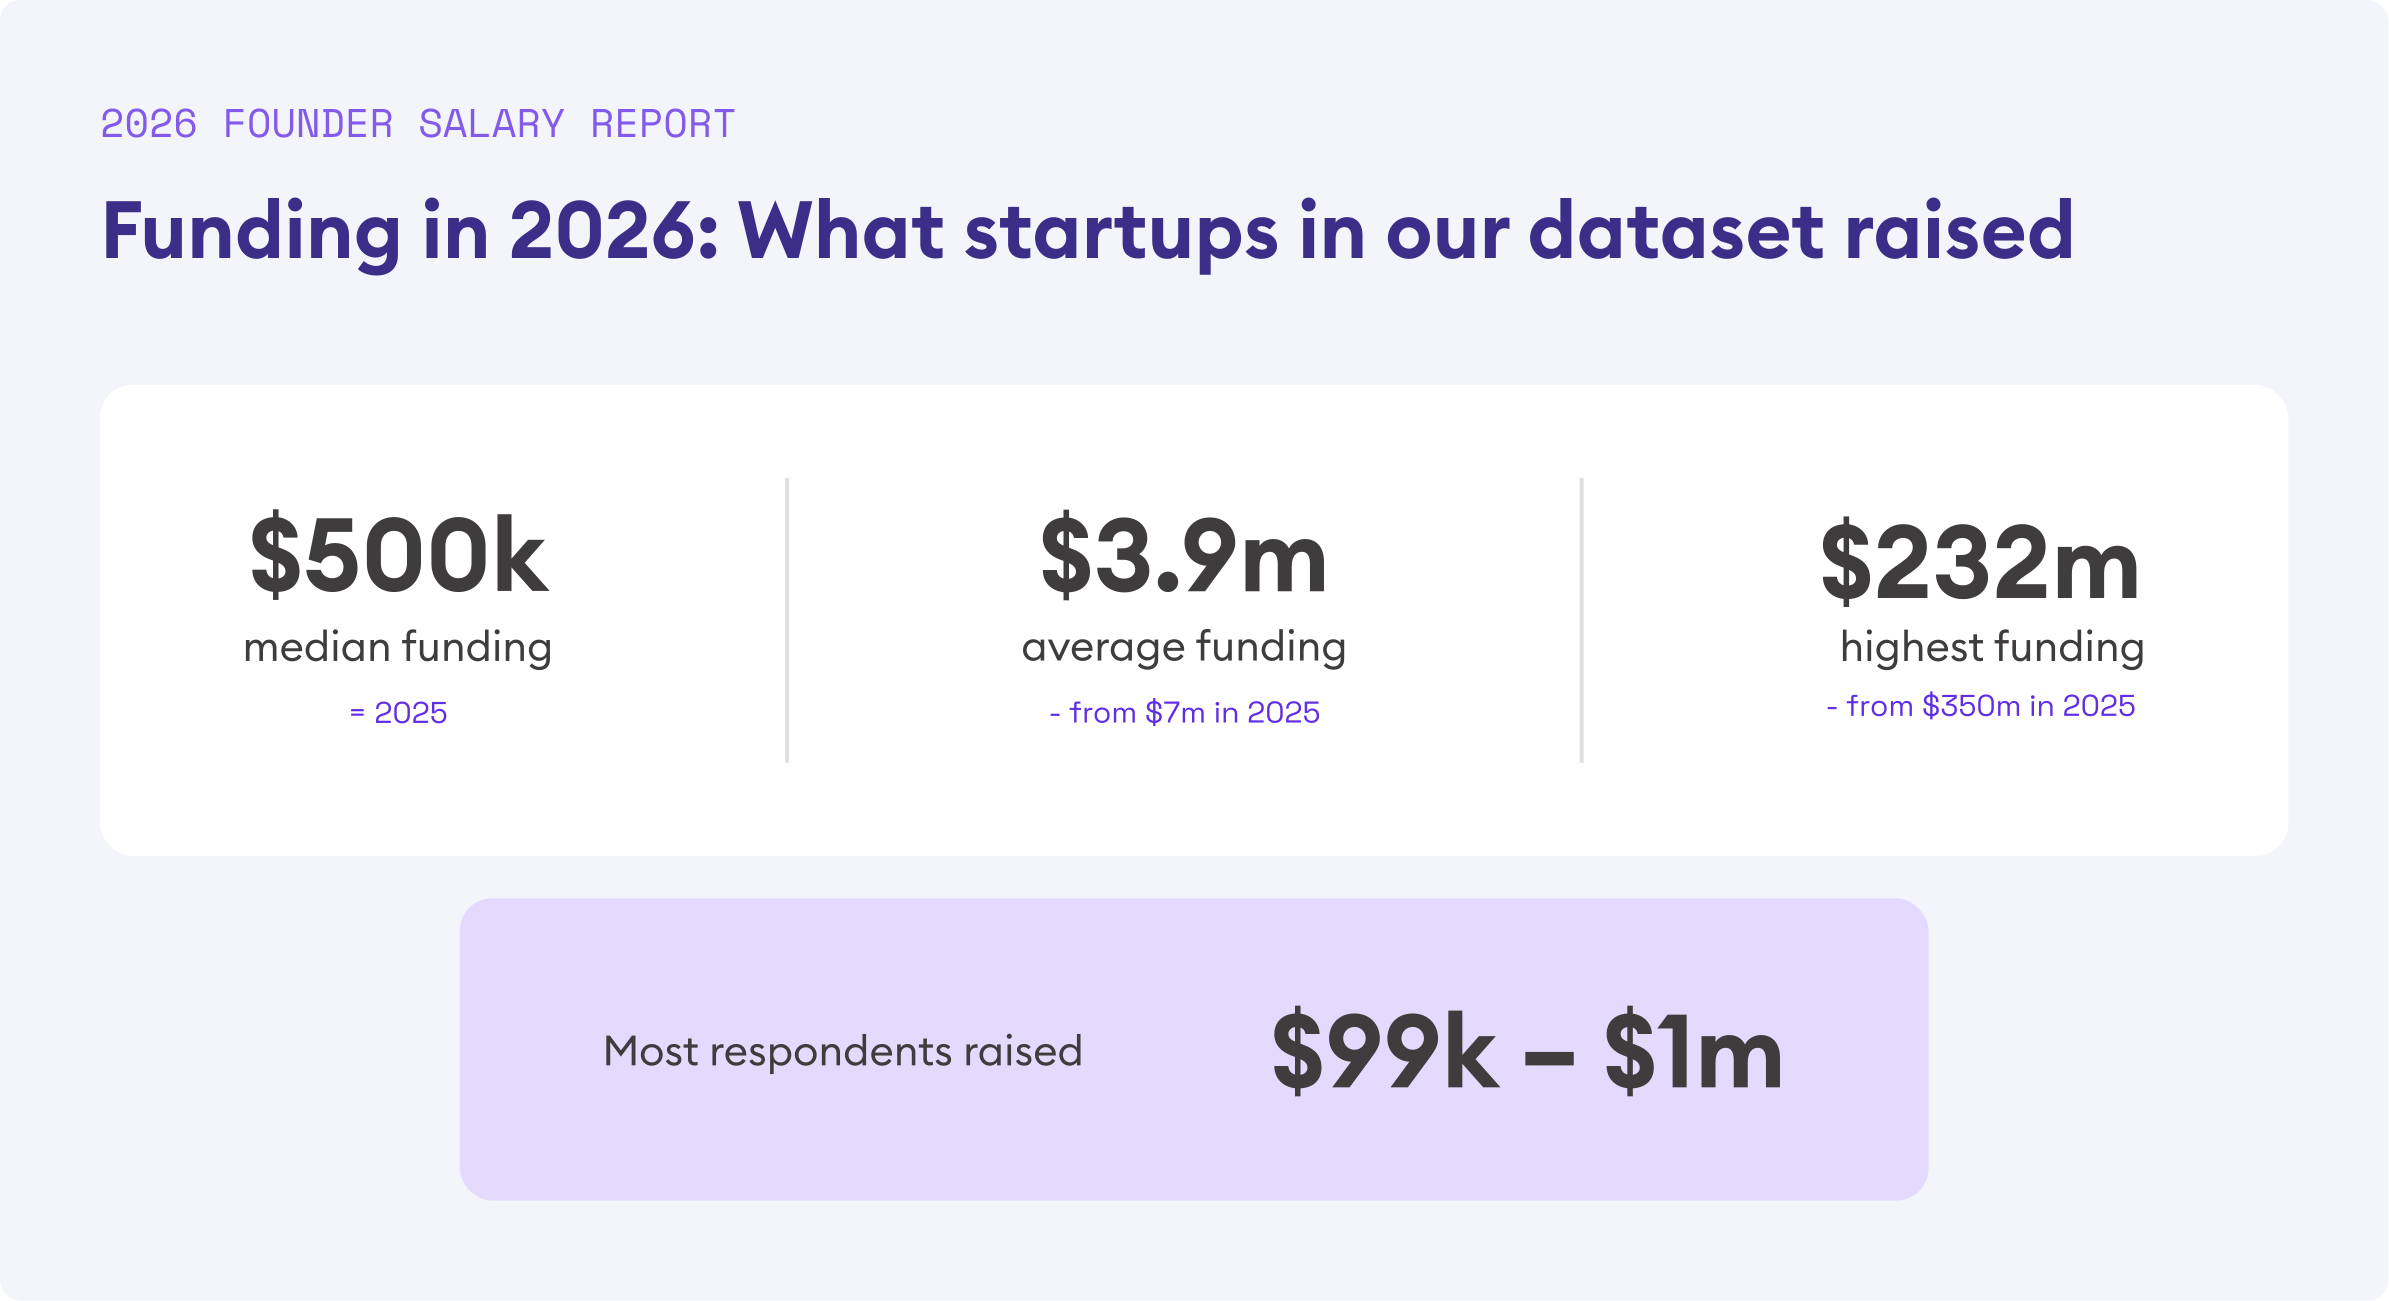
The median amount raised stayed flat at $500K, but the average was cut nearly in half, from $7M in 2025 to $3.9M in 2026. The highest raise in our dataset fell from $350M last year to $232M this year.
High raises, higher salary boost

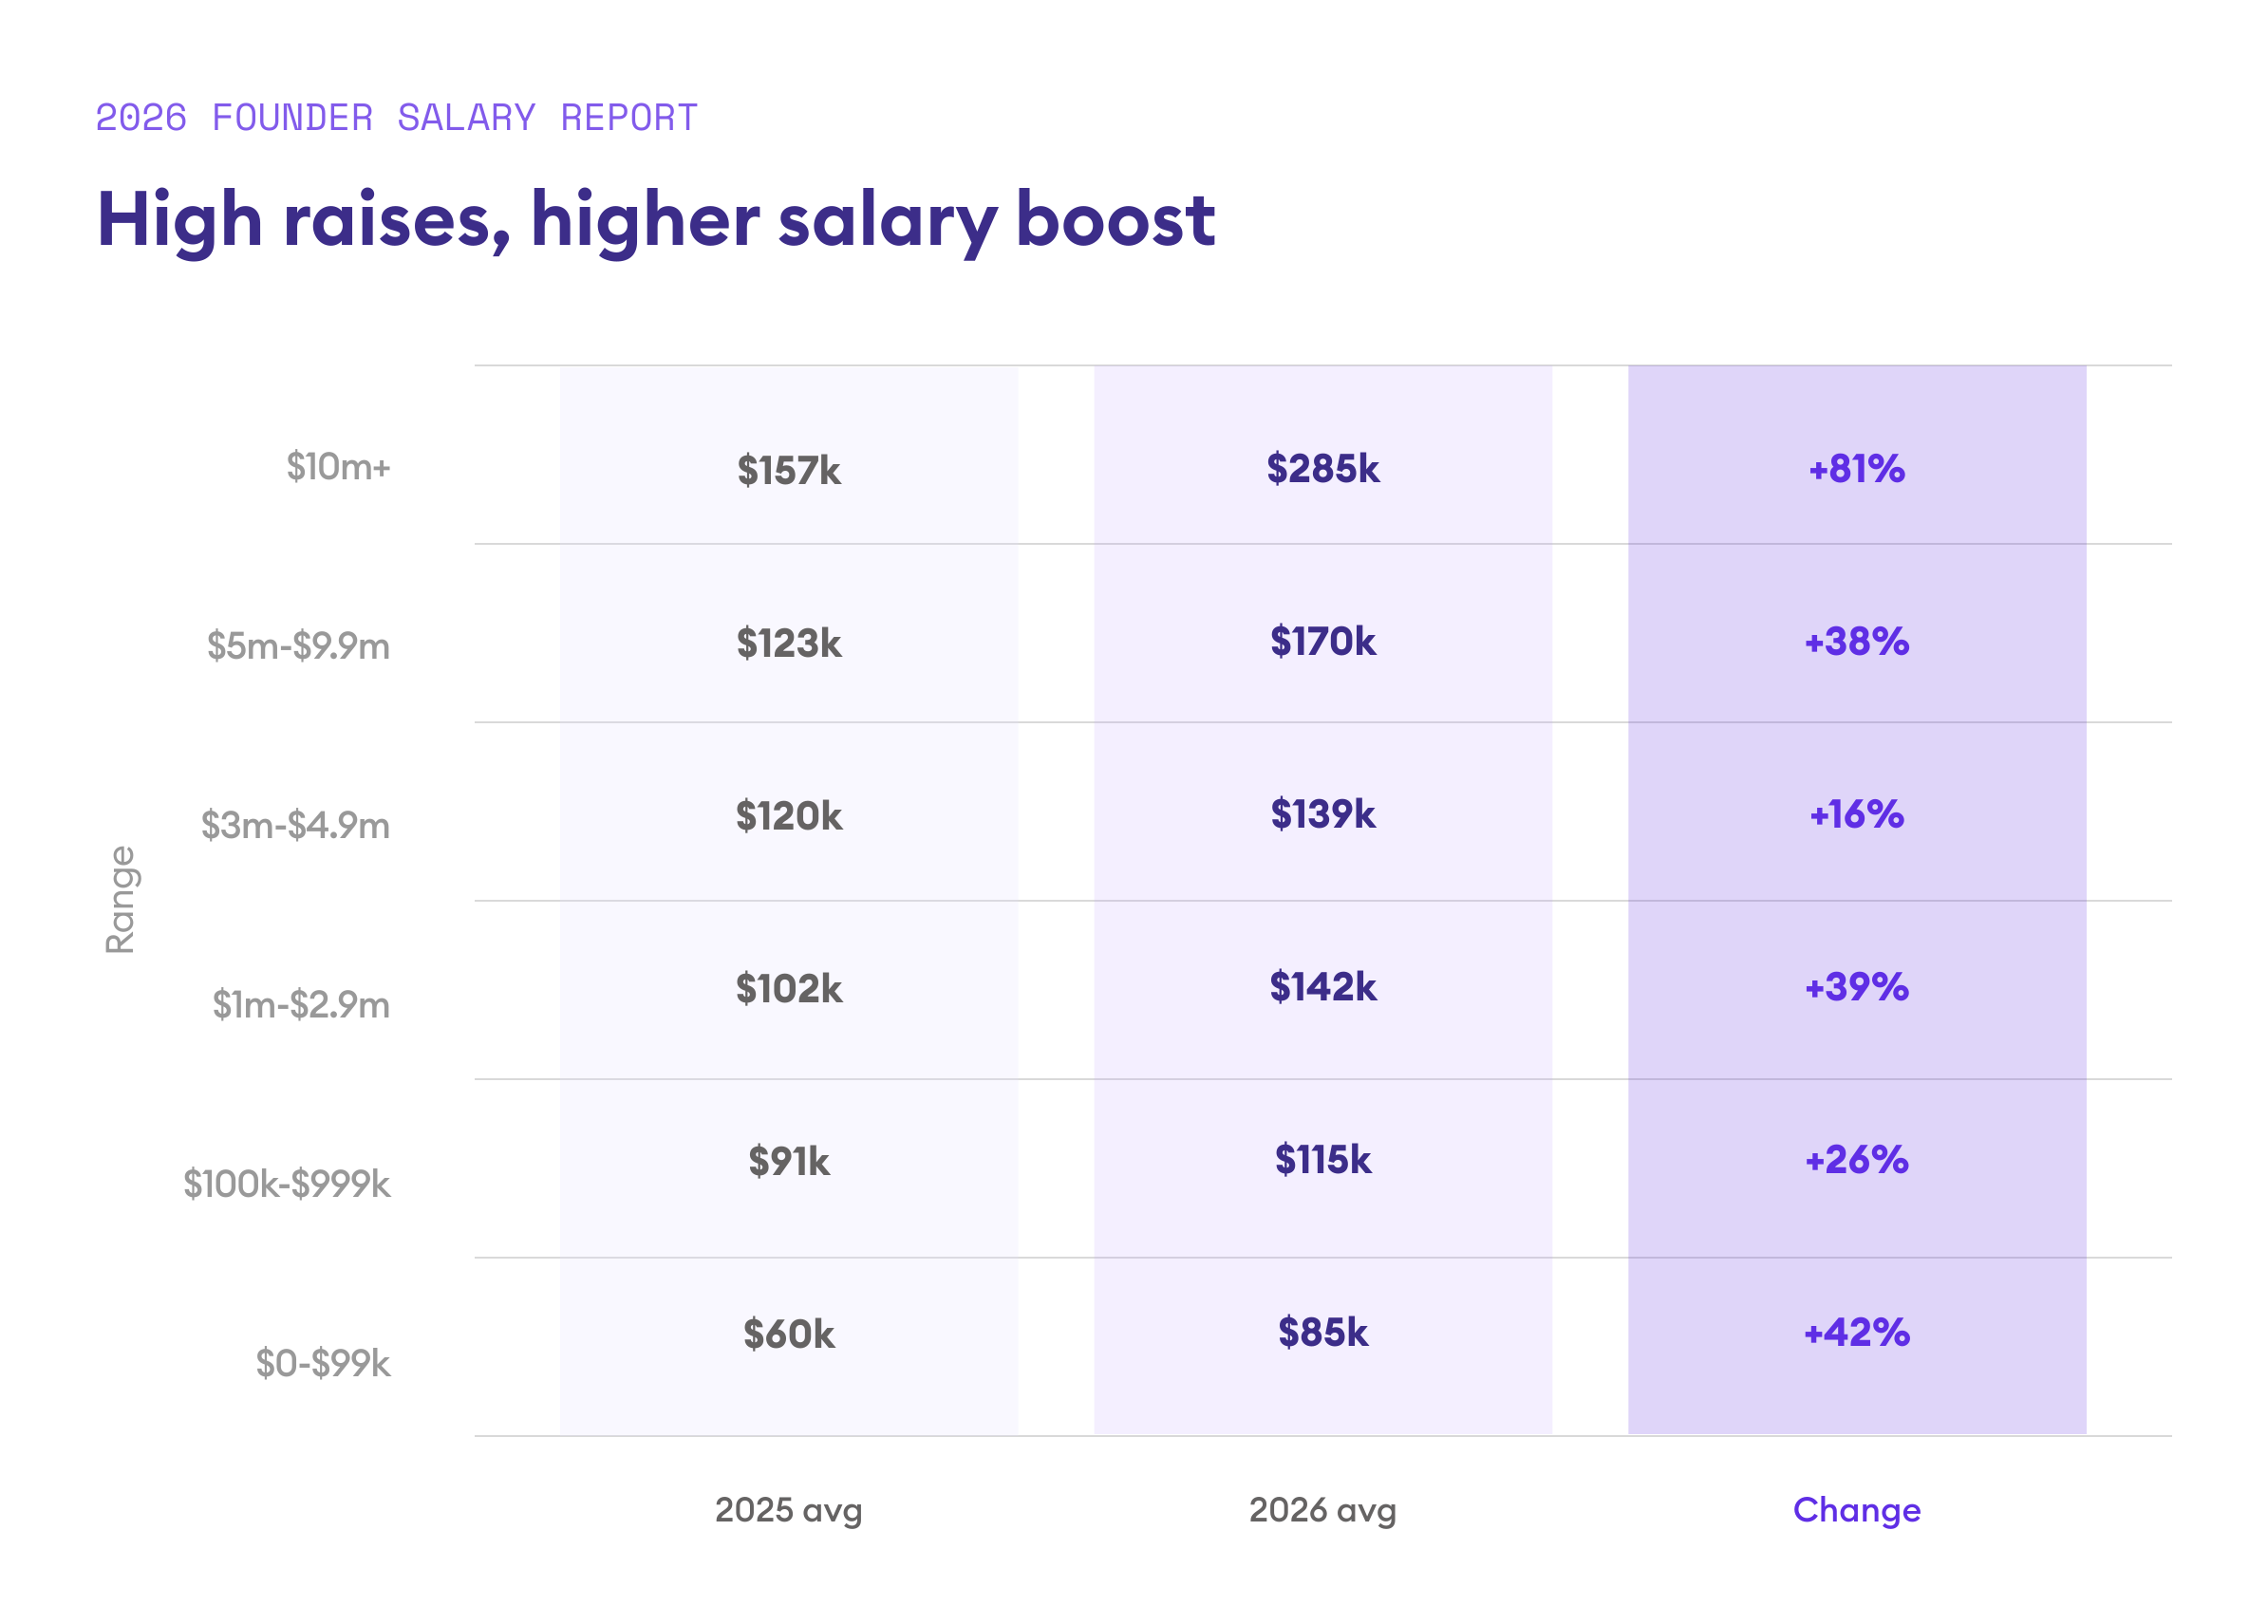
Despite this drop, salaries still recovered. Founders who raised over $10M saw an average increase of 81%. While well-funded founders recovered dramatically, everyone else recovered more modestly.
Bootstrapping is on the rise

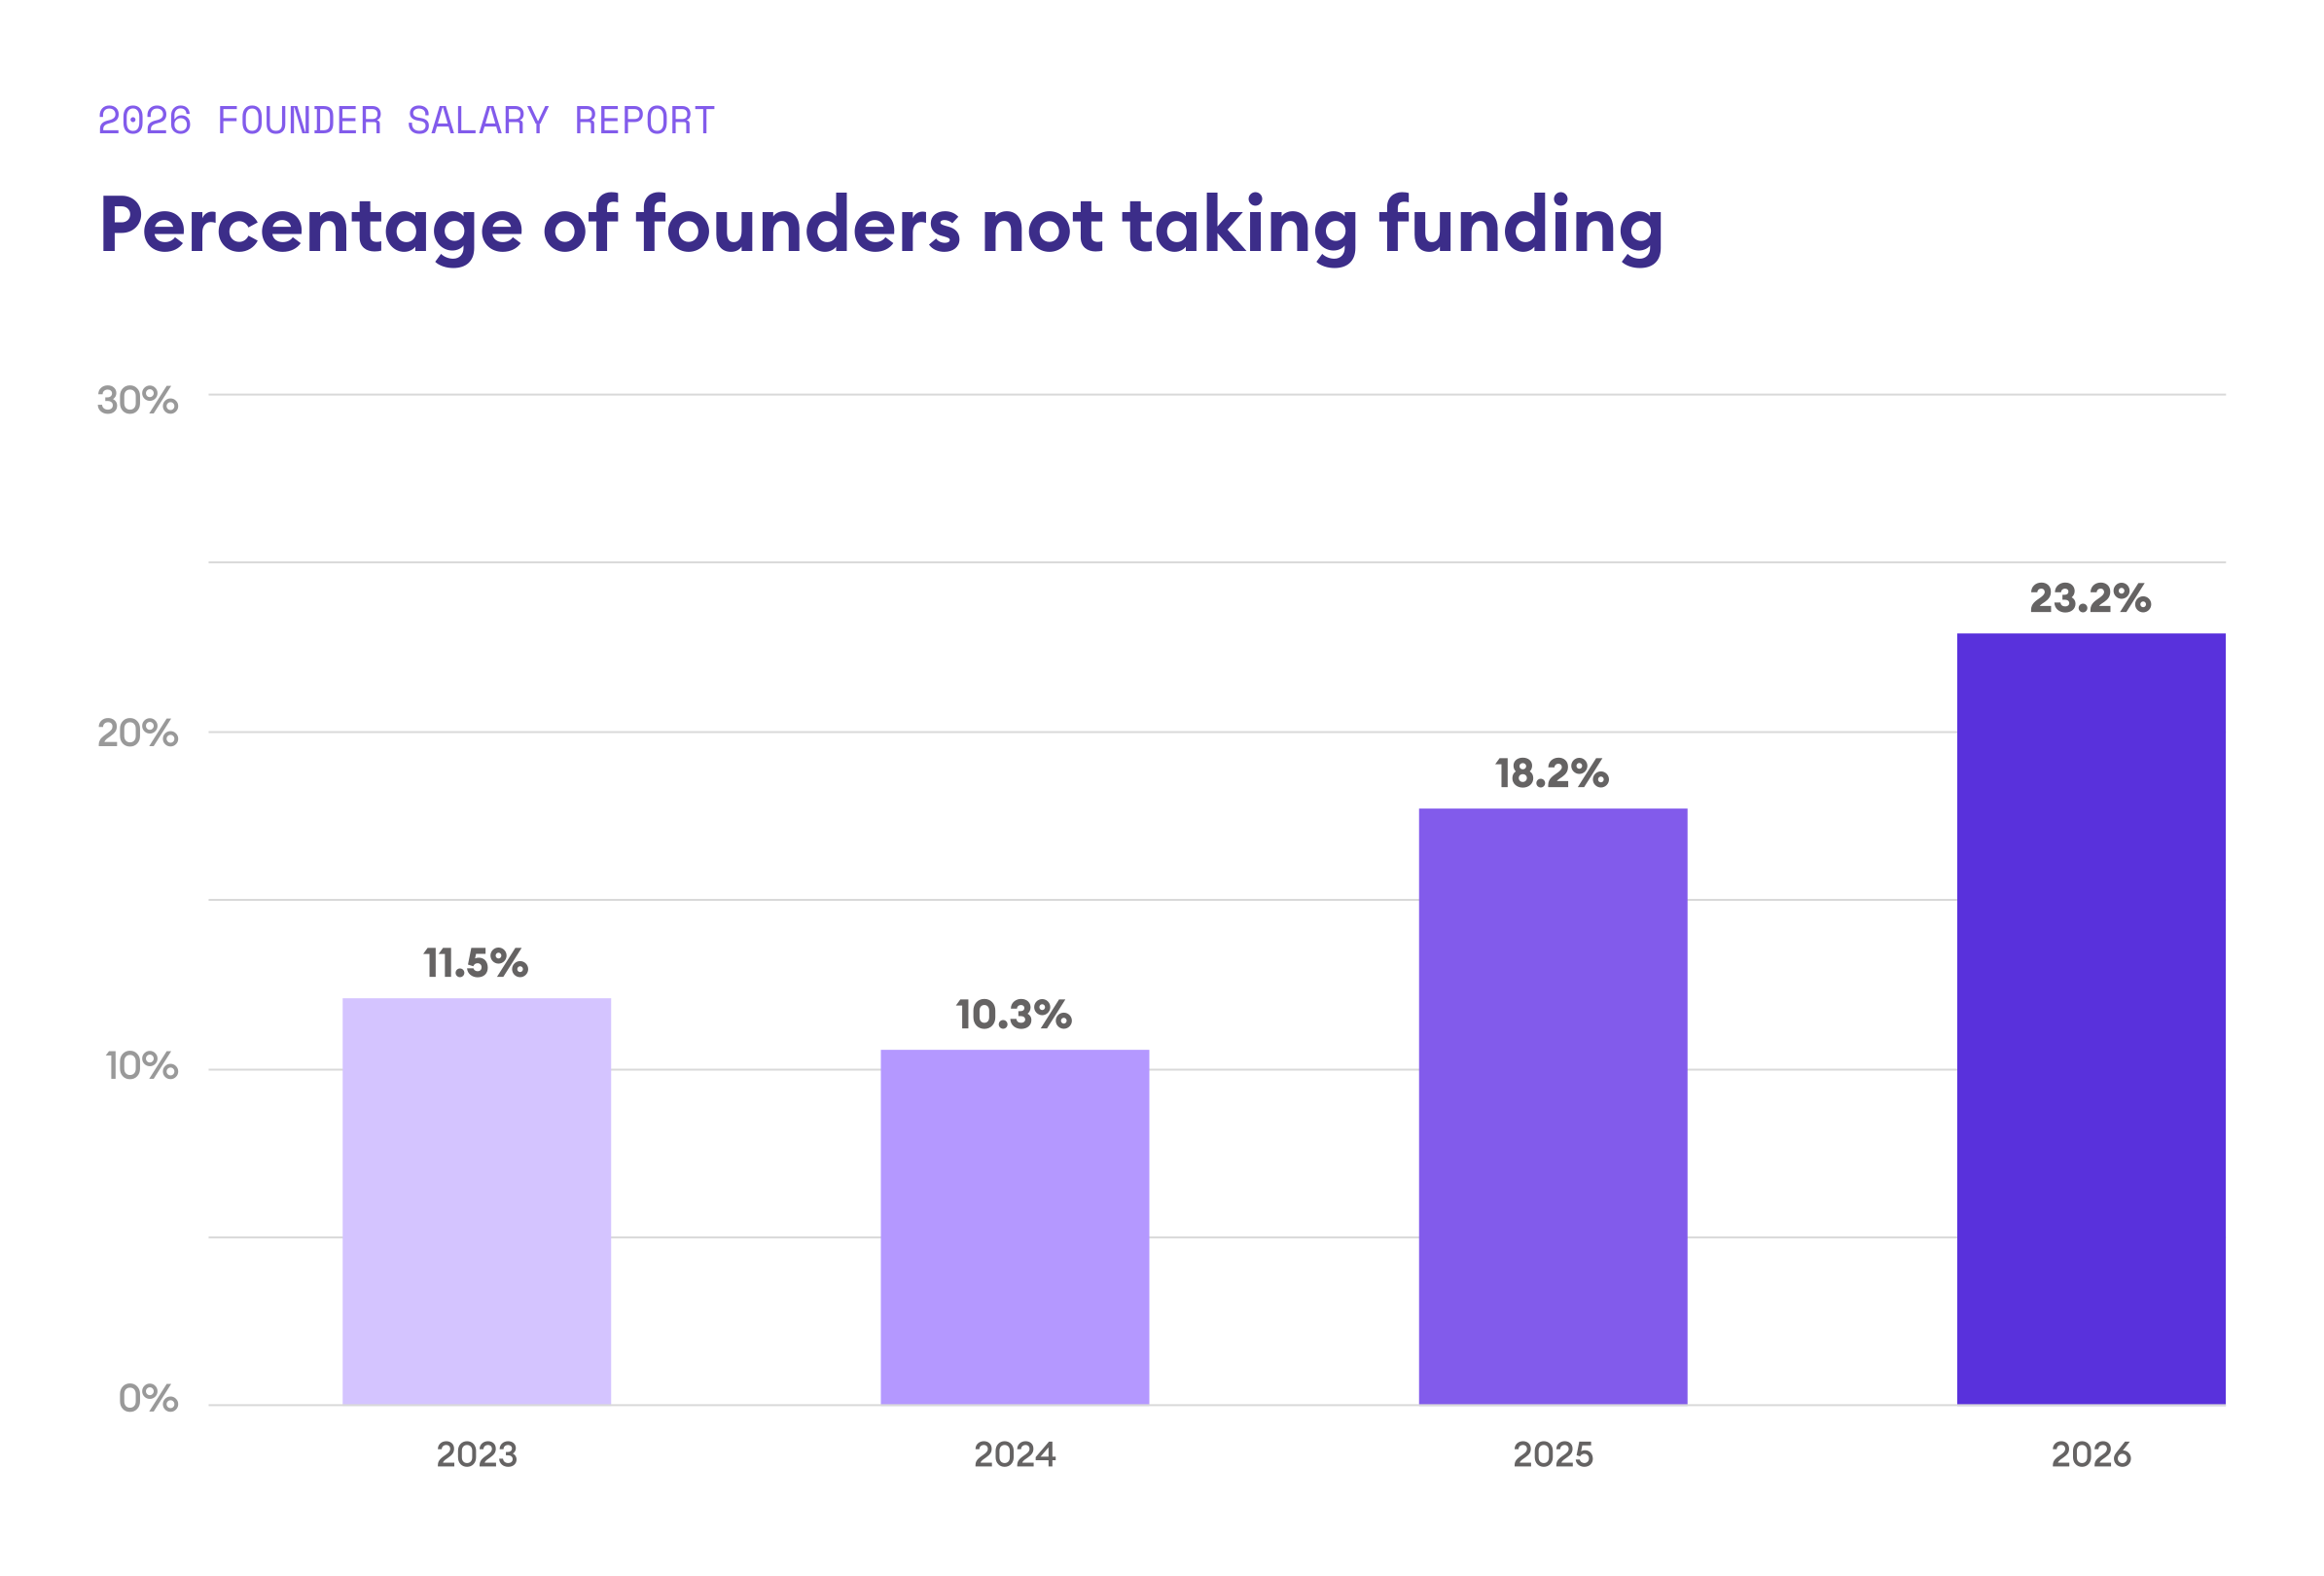
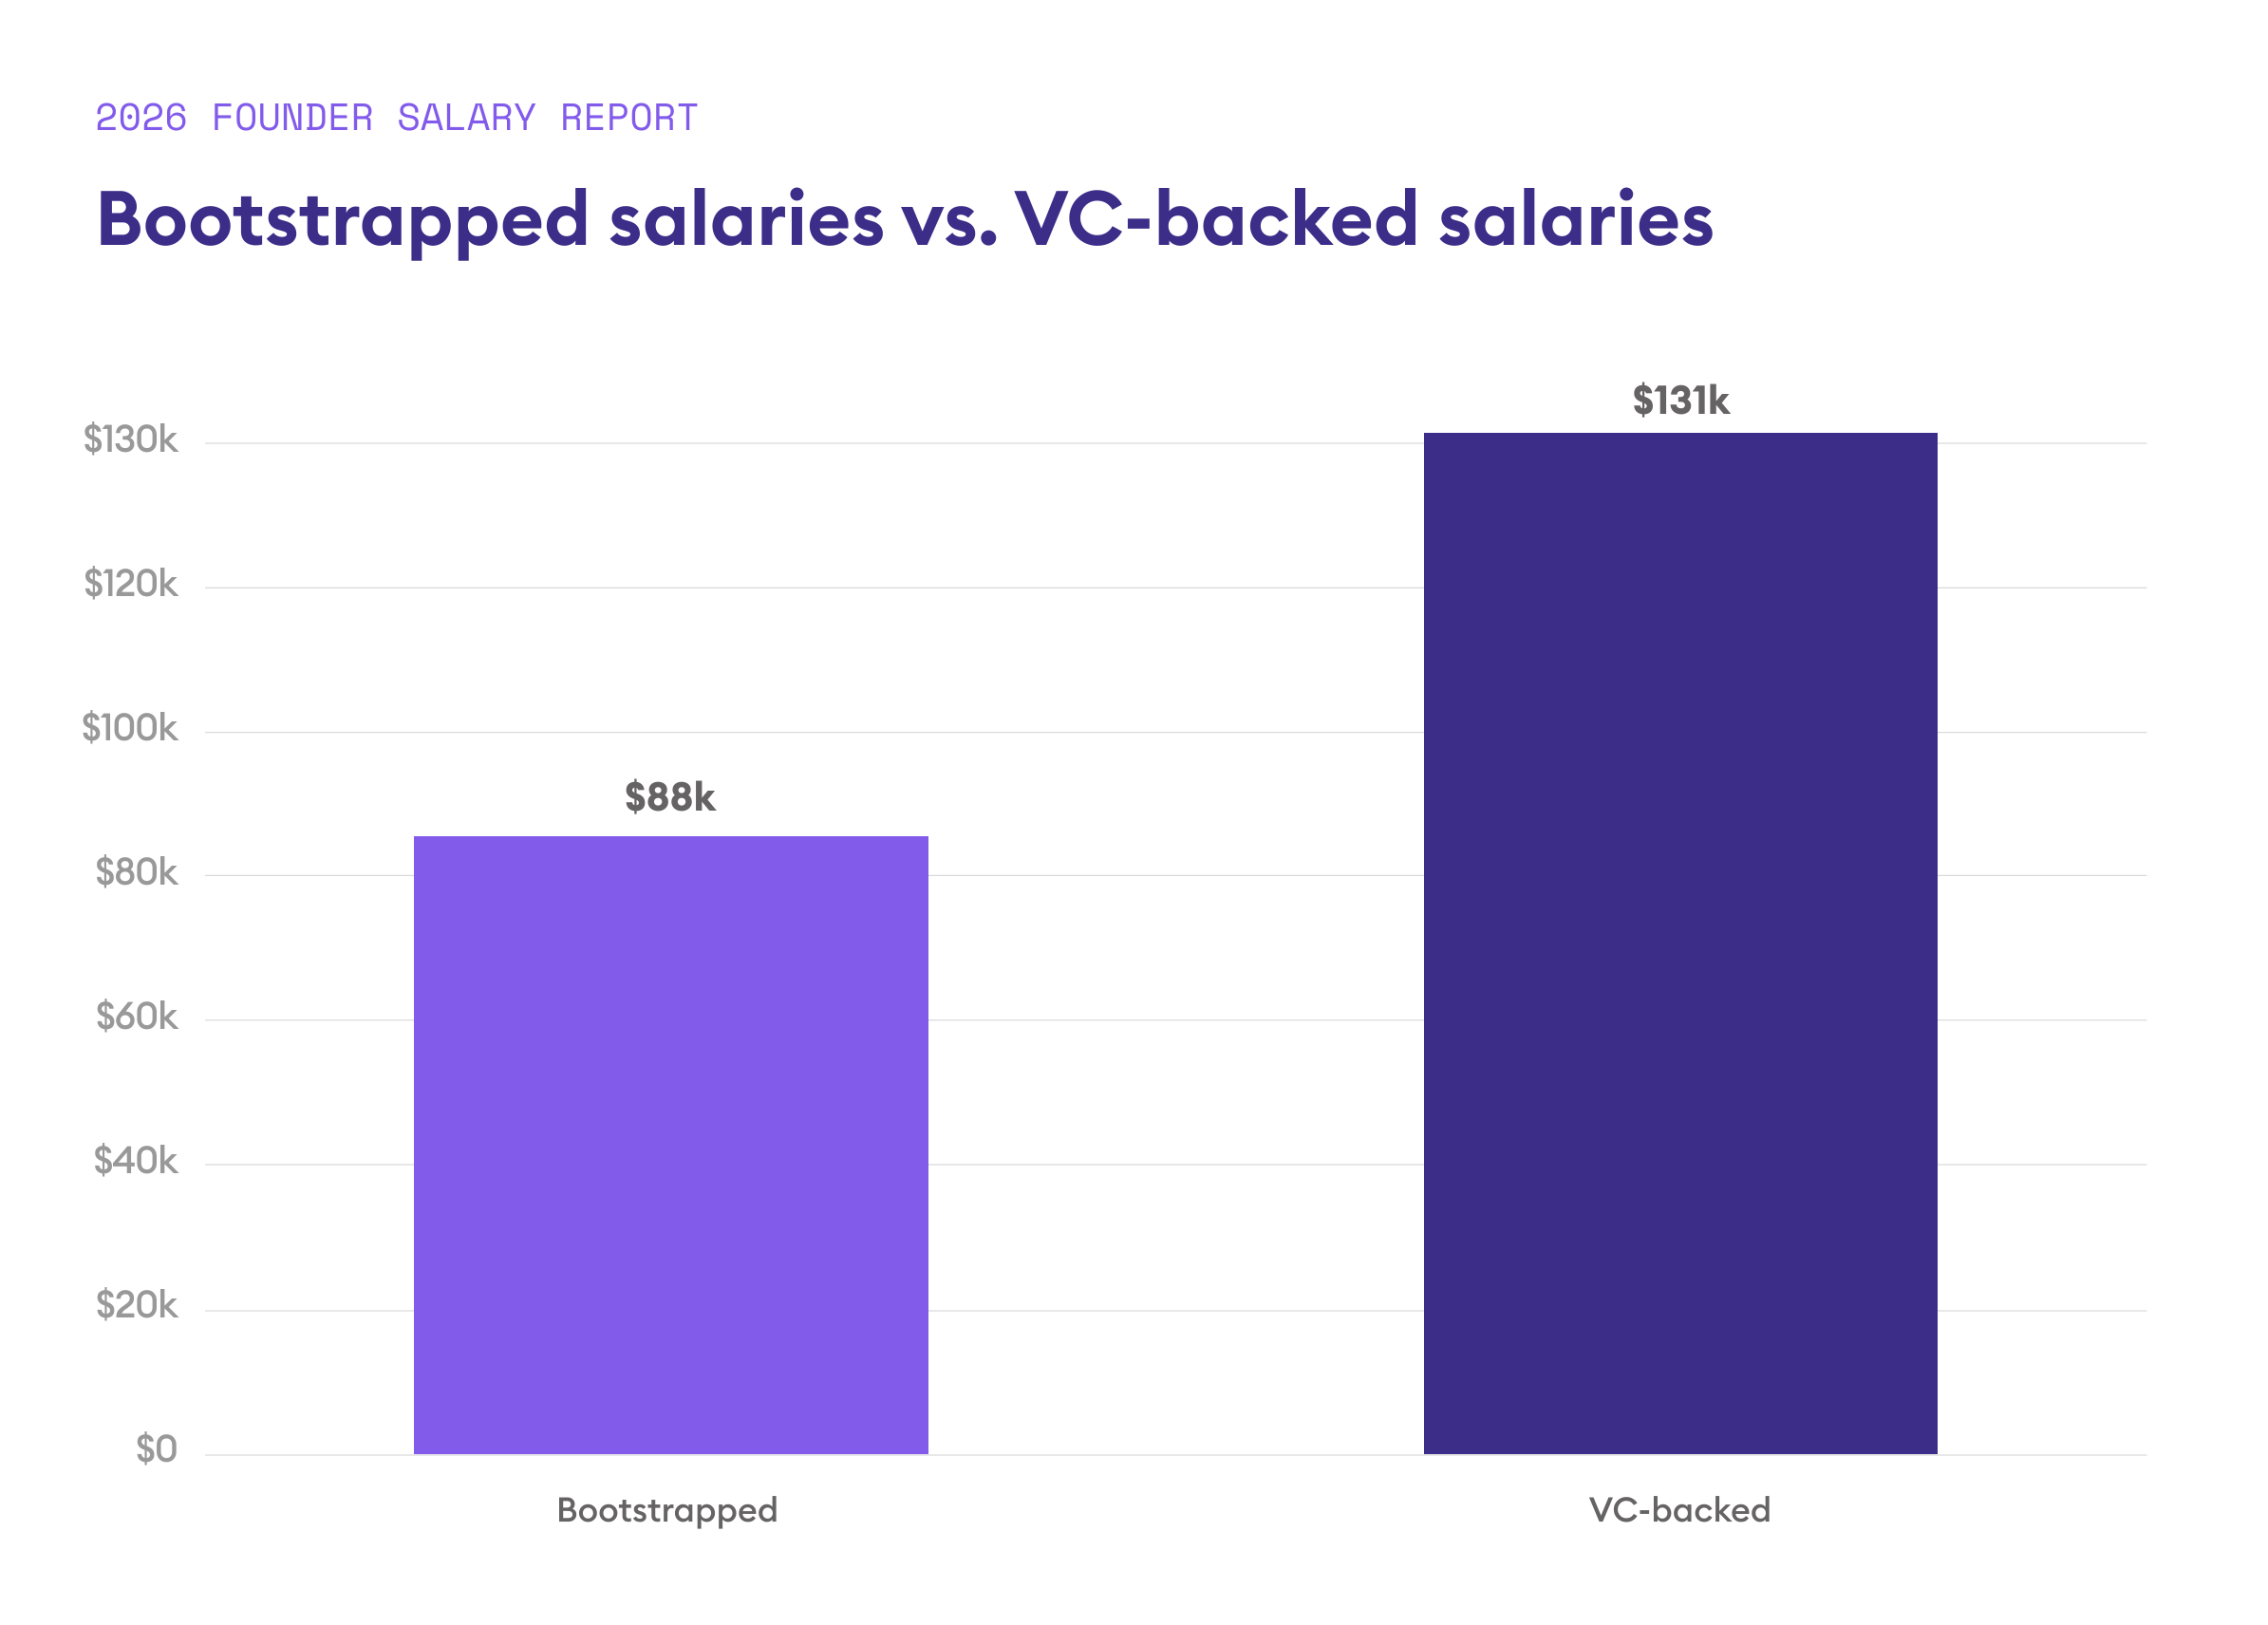
Nearly 1 in 4 founders took no outside funding in 2026, up from 1 in 5 last year. Bootstrapped founders pay themselves less than their VC-backed counterparts: $88K on average compared to $131K.
OUR TAKE
Whether you've raised $10M or nothing at all, the question is the same: are you making the most of what you have? That starts with clean books, accurate financials, and a clear picture of your runway. The founders with that clarity can make confident business decisions, including what to pay themselves.
Salary by company size

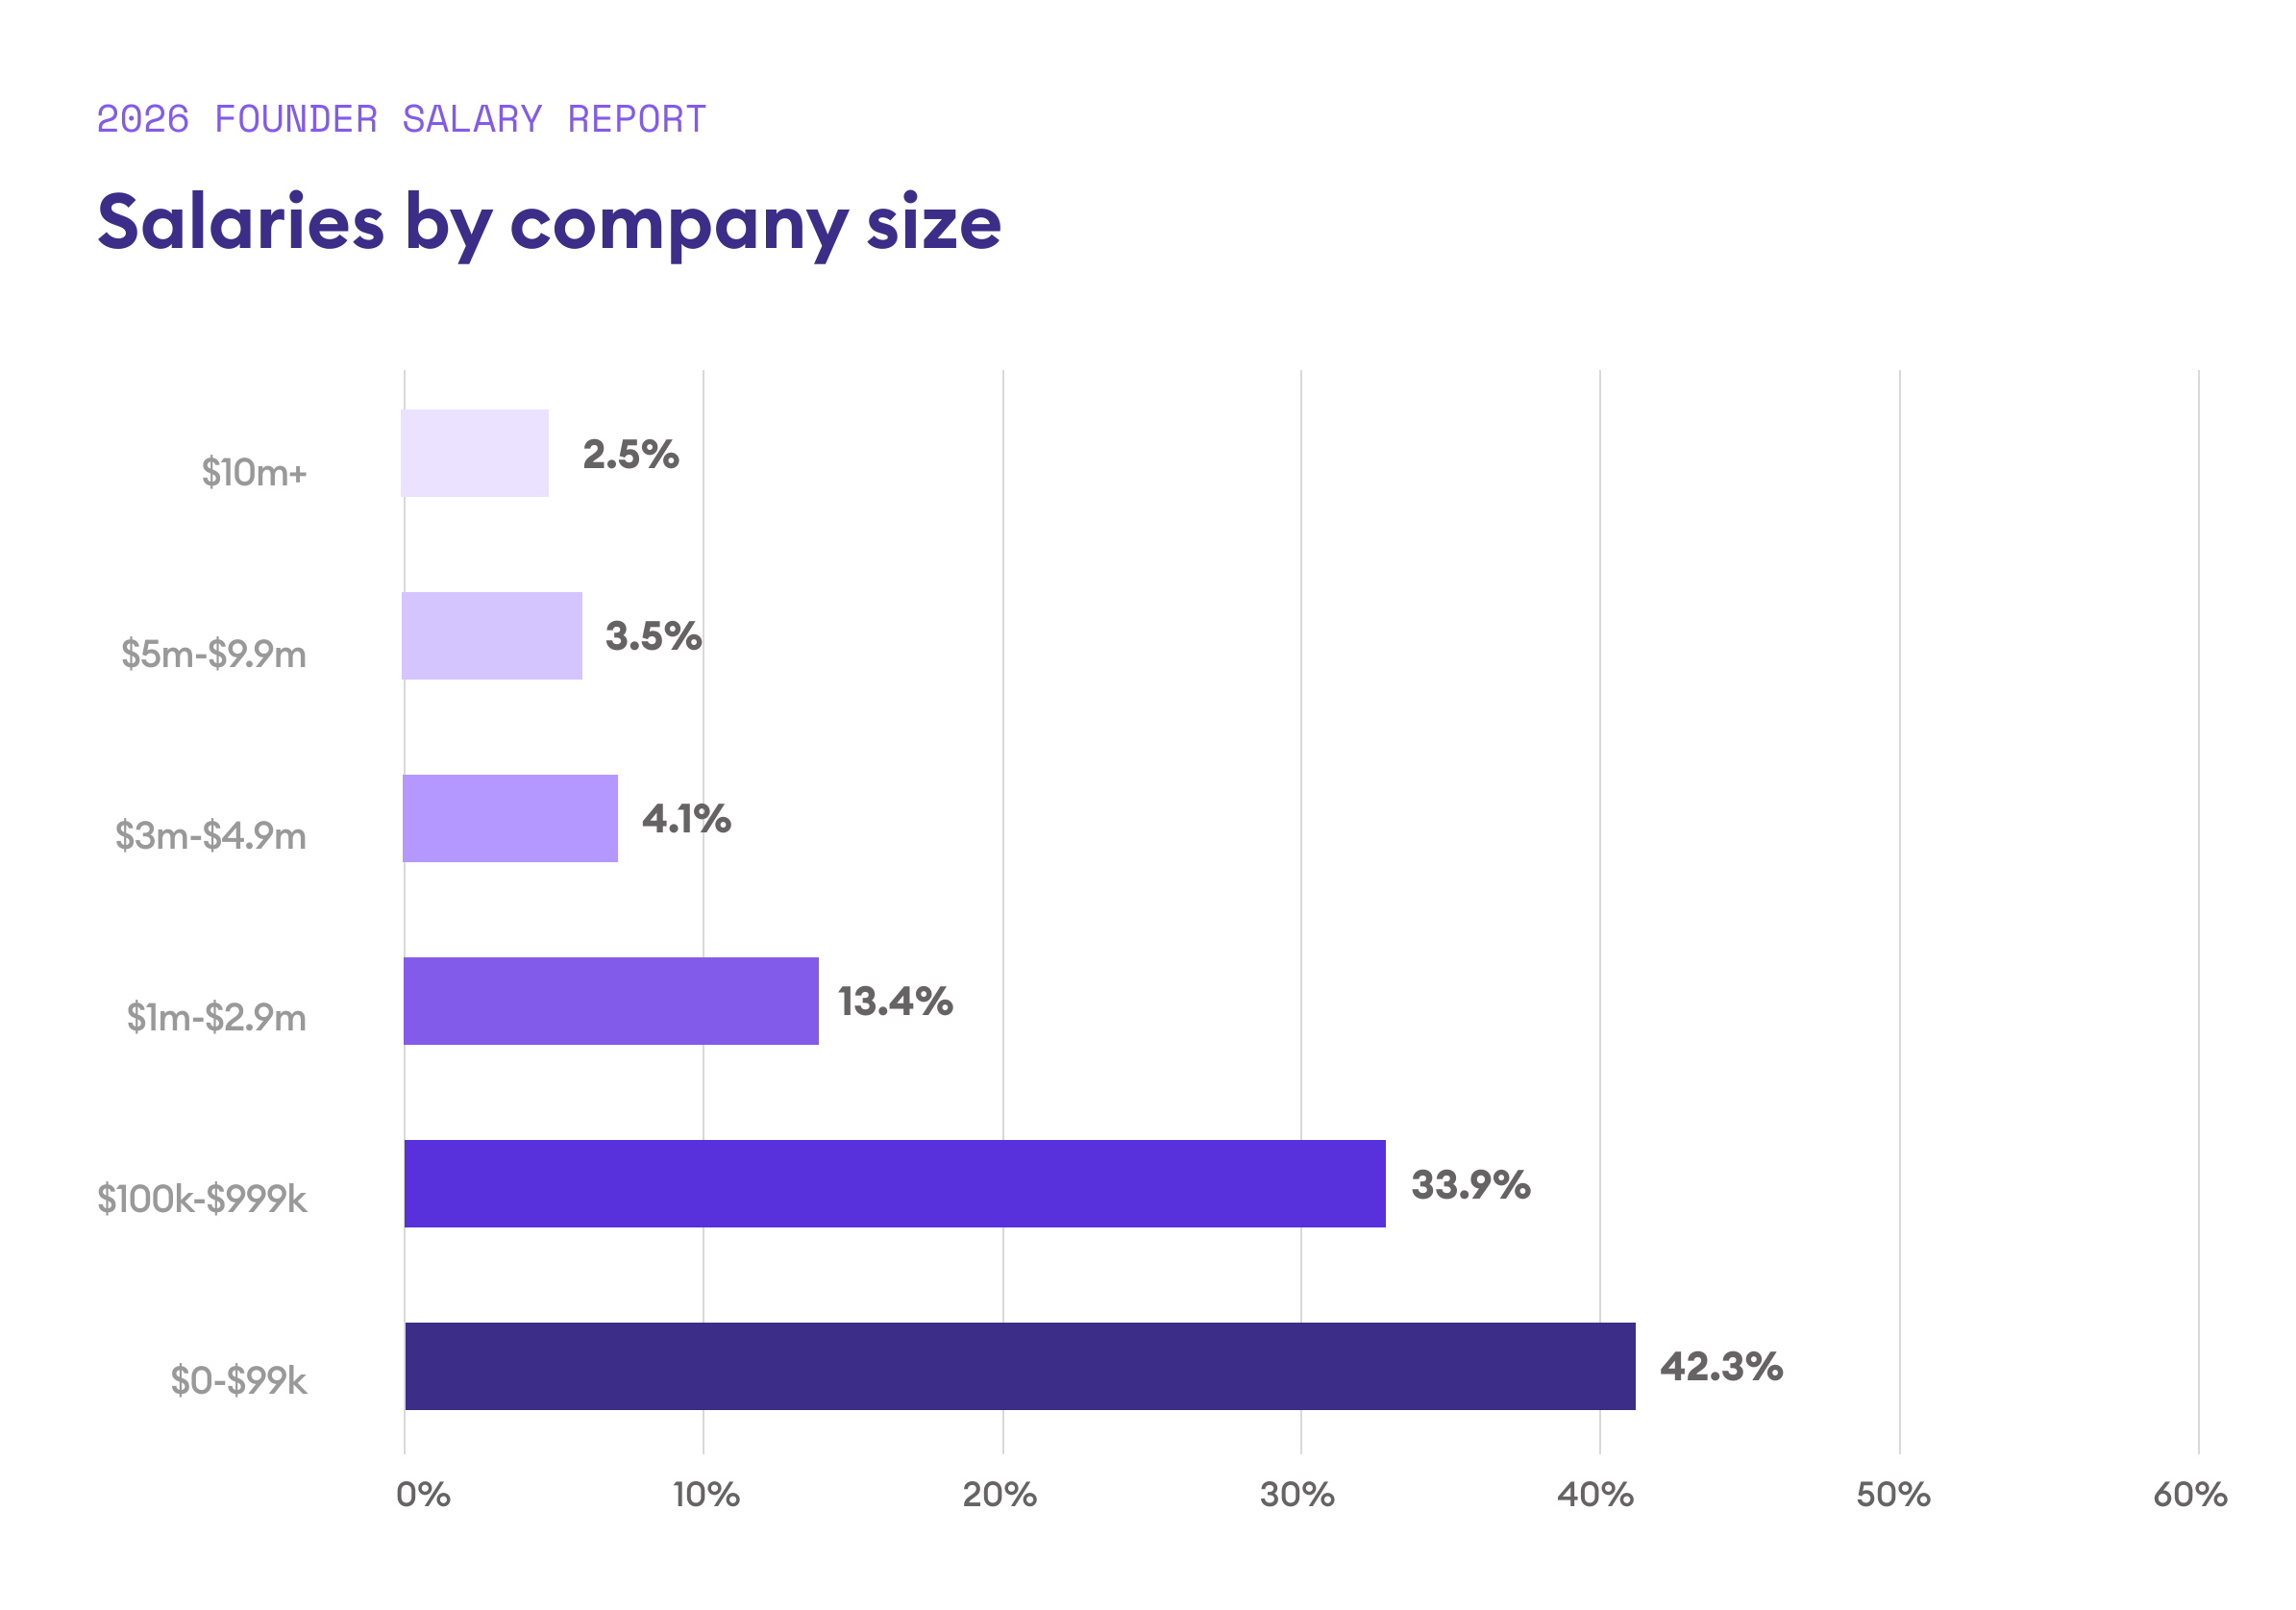
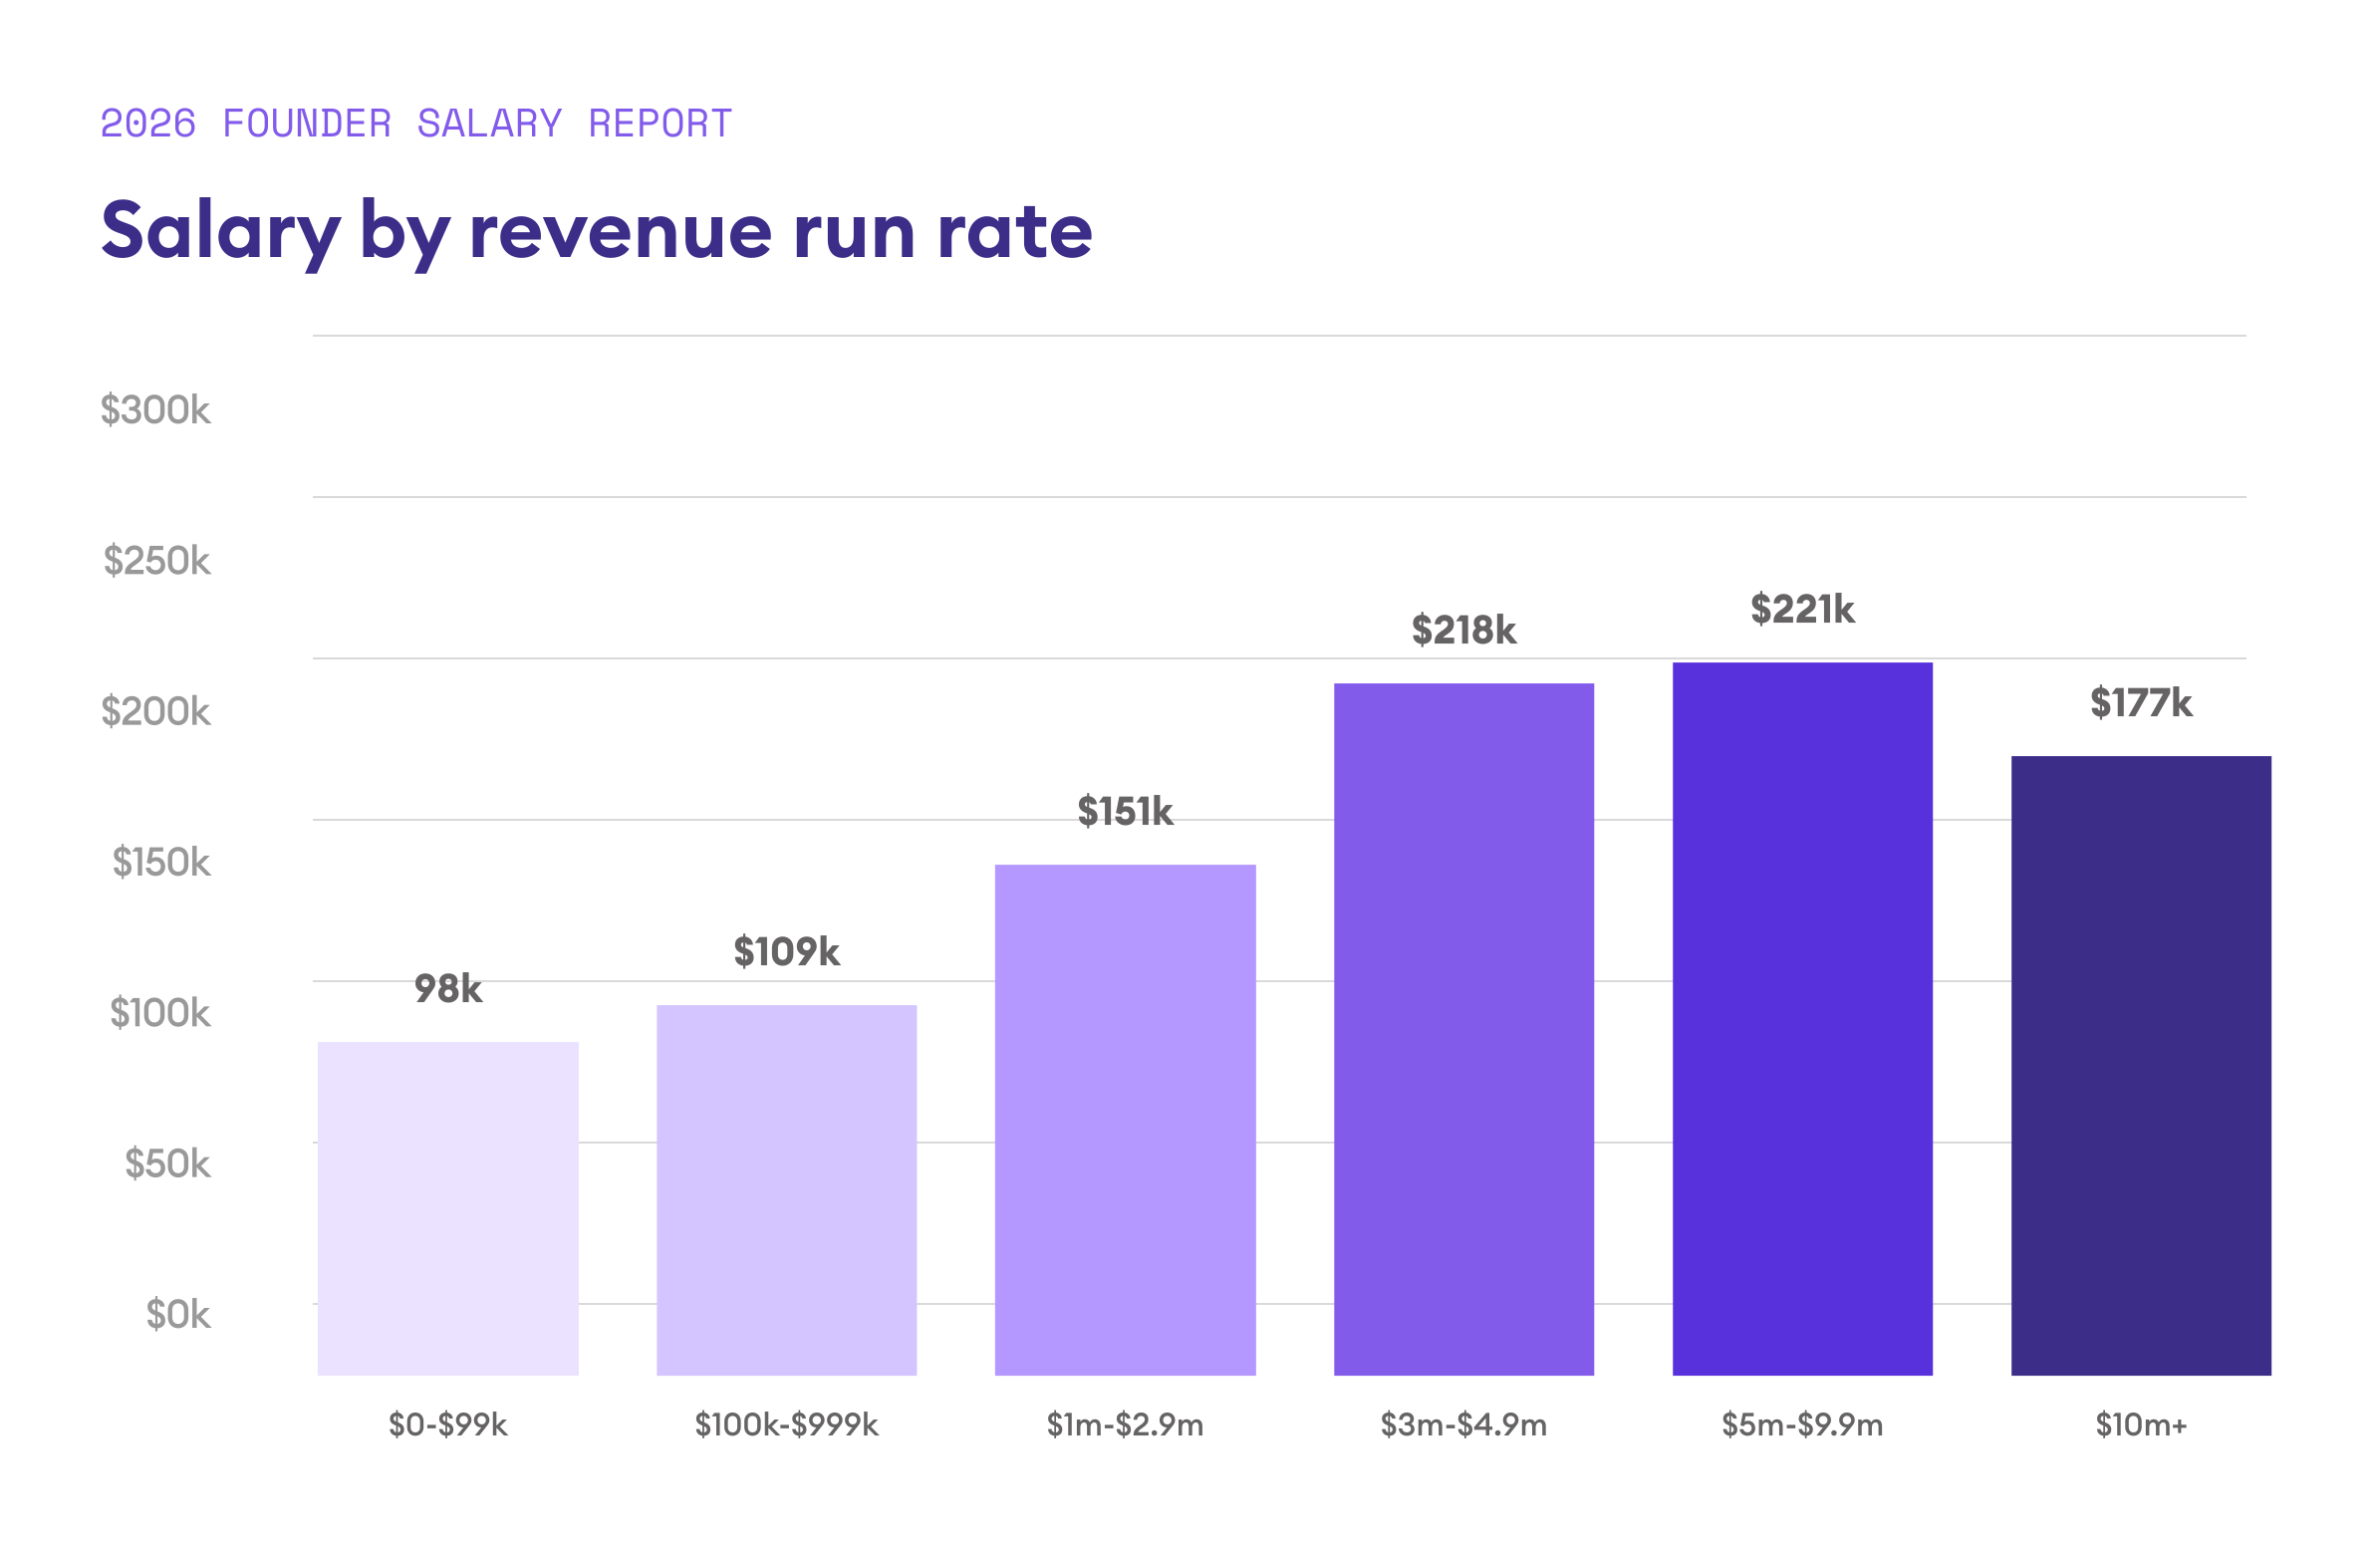
Revenue and team size drive salary

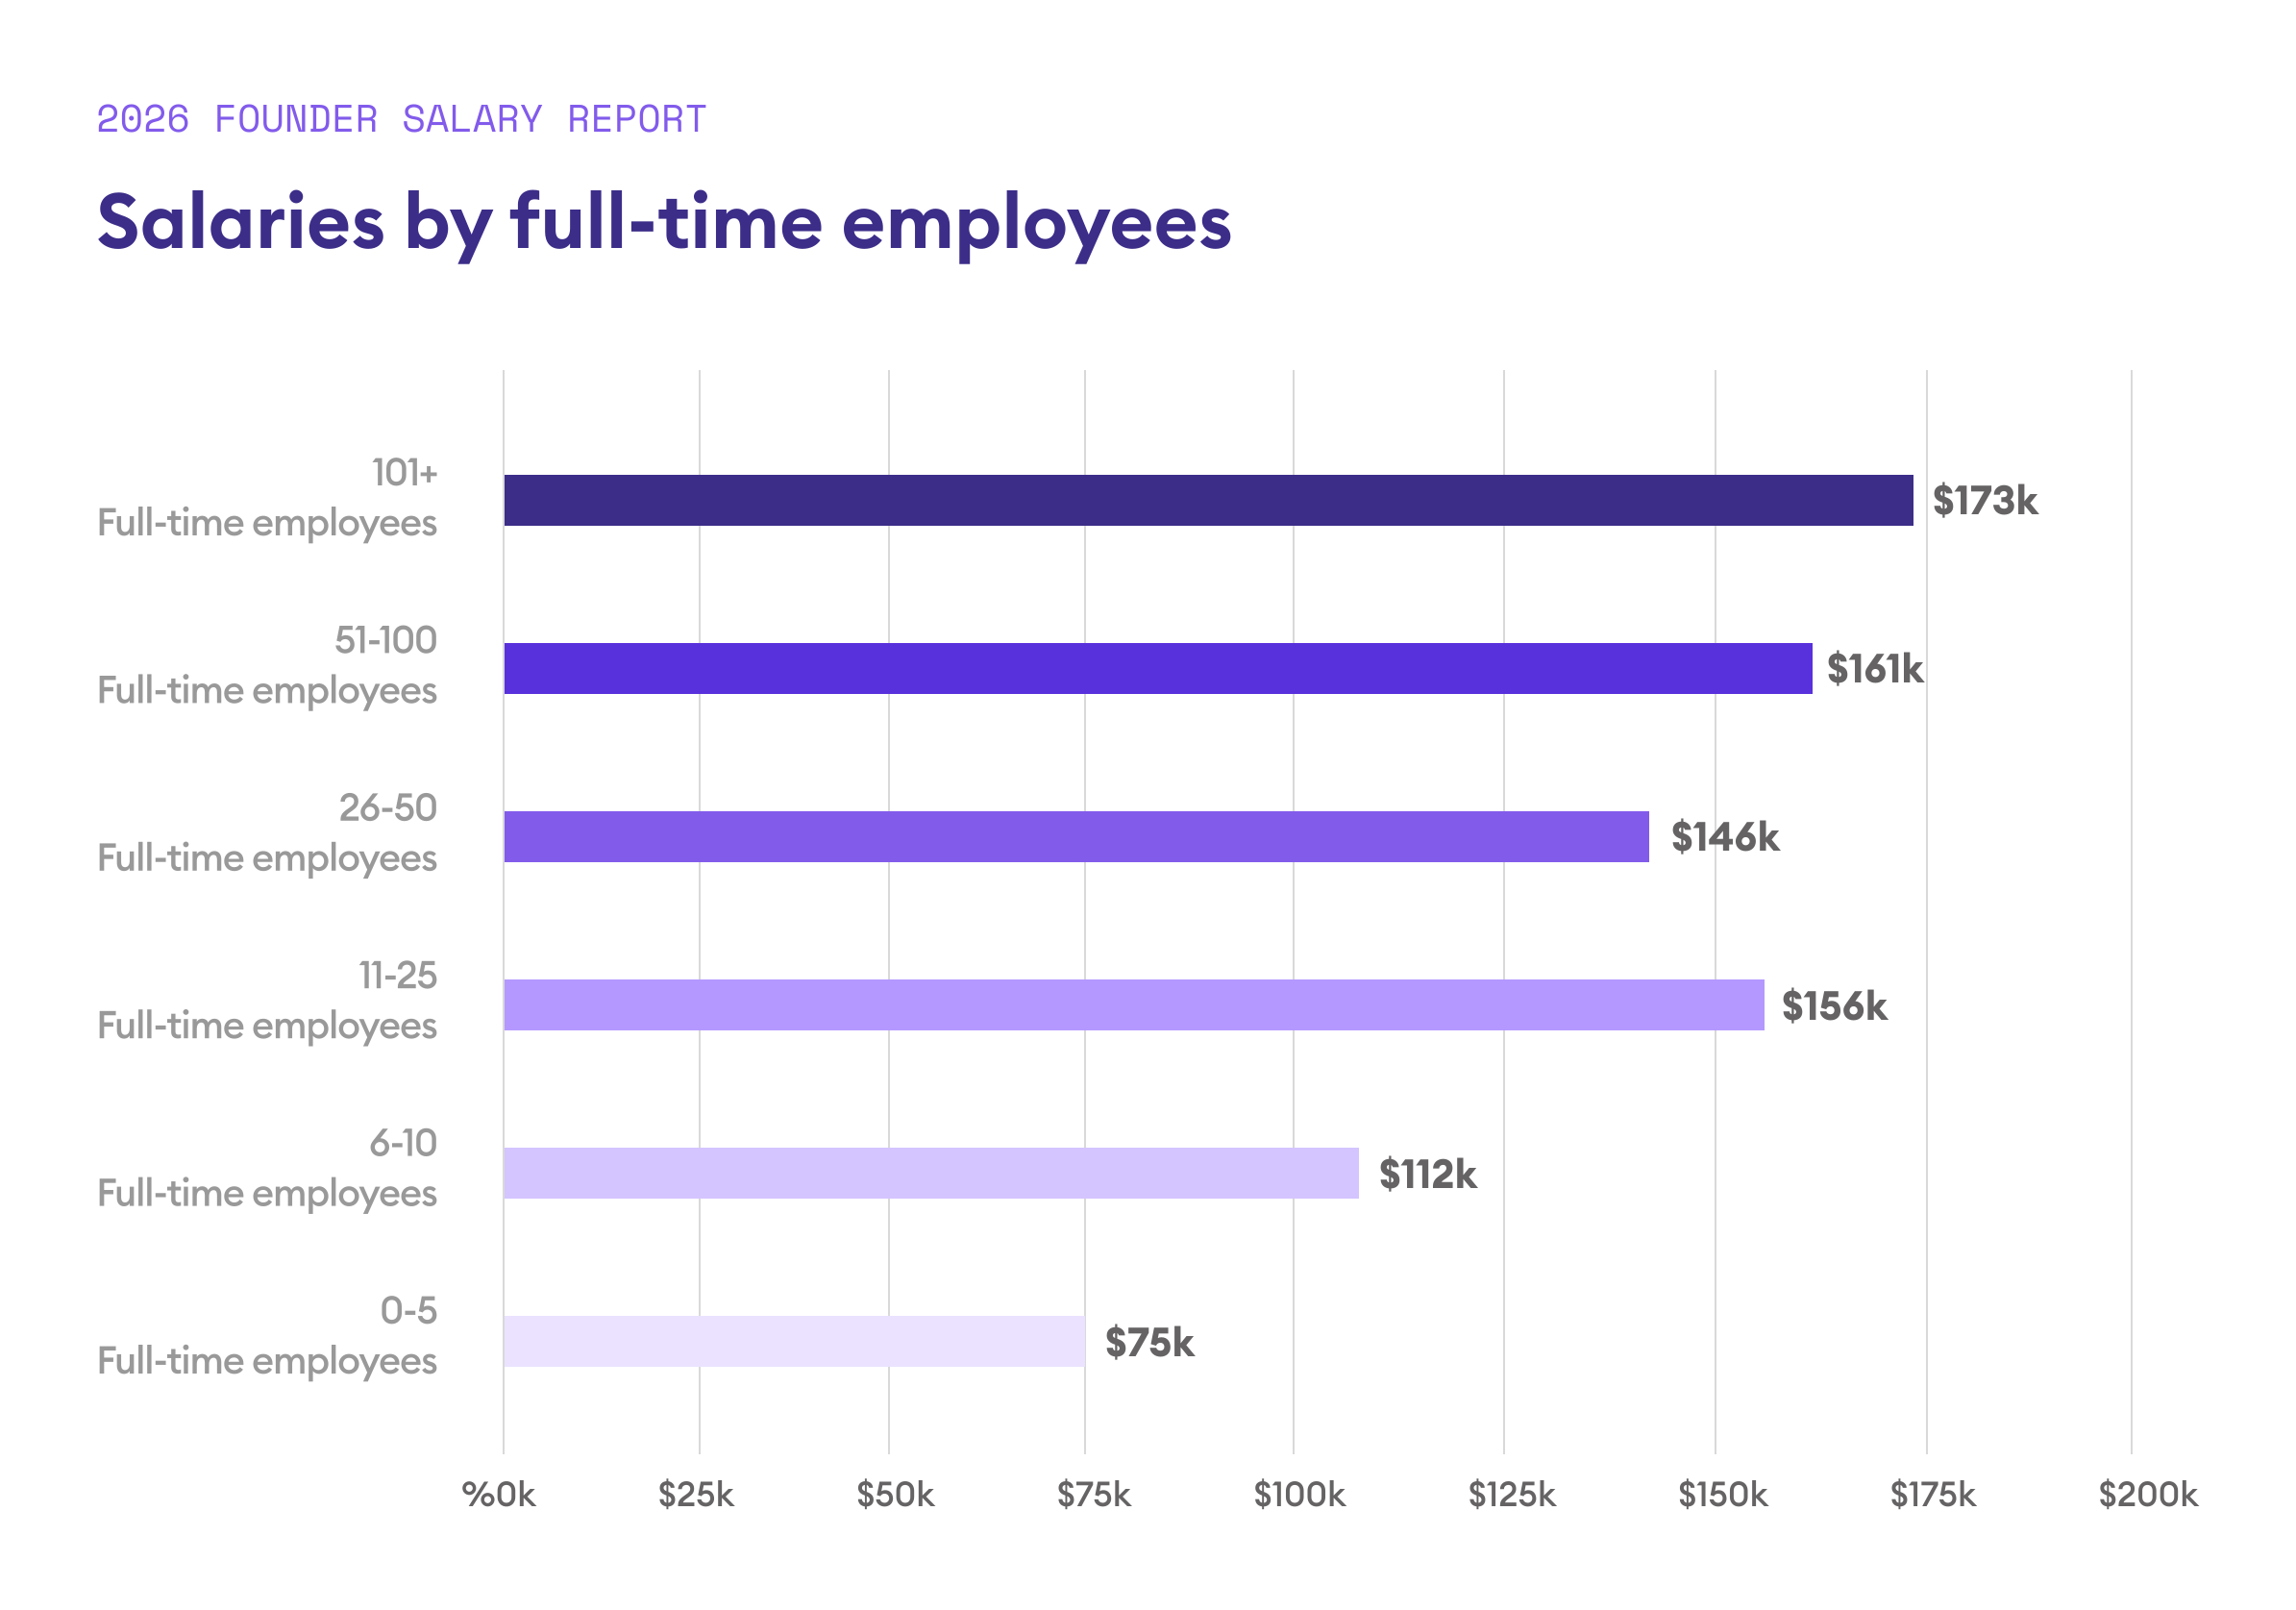
The data shows two clear growth signals for founder pay: revenue and headcount. As your run rate climbs, so does your salary—up to around $3M, where it plateaus. And the more people you hire, the more you tend to pay yourself. Together, these two variables paint the clearest picture of where your salary should be heading as you grow.
Team size is the clearest signal

Founders with fewer than five employees average $75K. At six to ten, that jumps to $112K, close to the overall average. After 11 employees, salary accelerates further to $156K.
OUR TAKE
Growing your business is the clearest path to a higher salary, but you can't get there without understanding your financial foundation first. Knowing when to make that next hire requires a clear picture of your runway, your revenue, and what your business can afford.
Salaries by industry

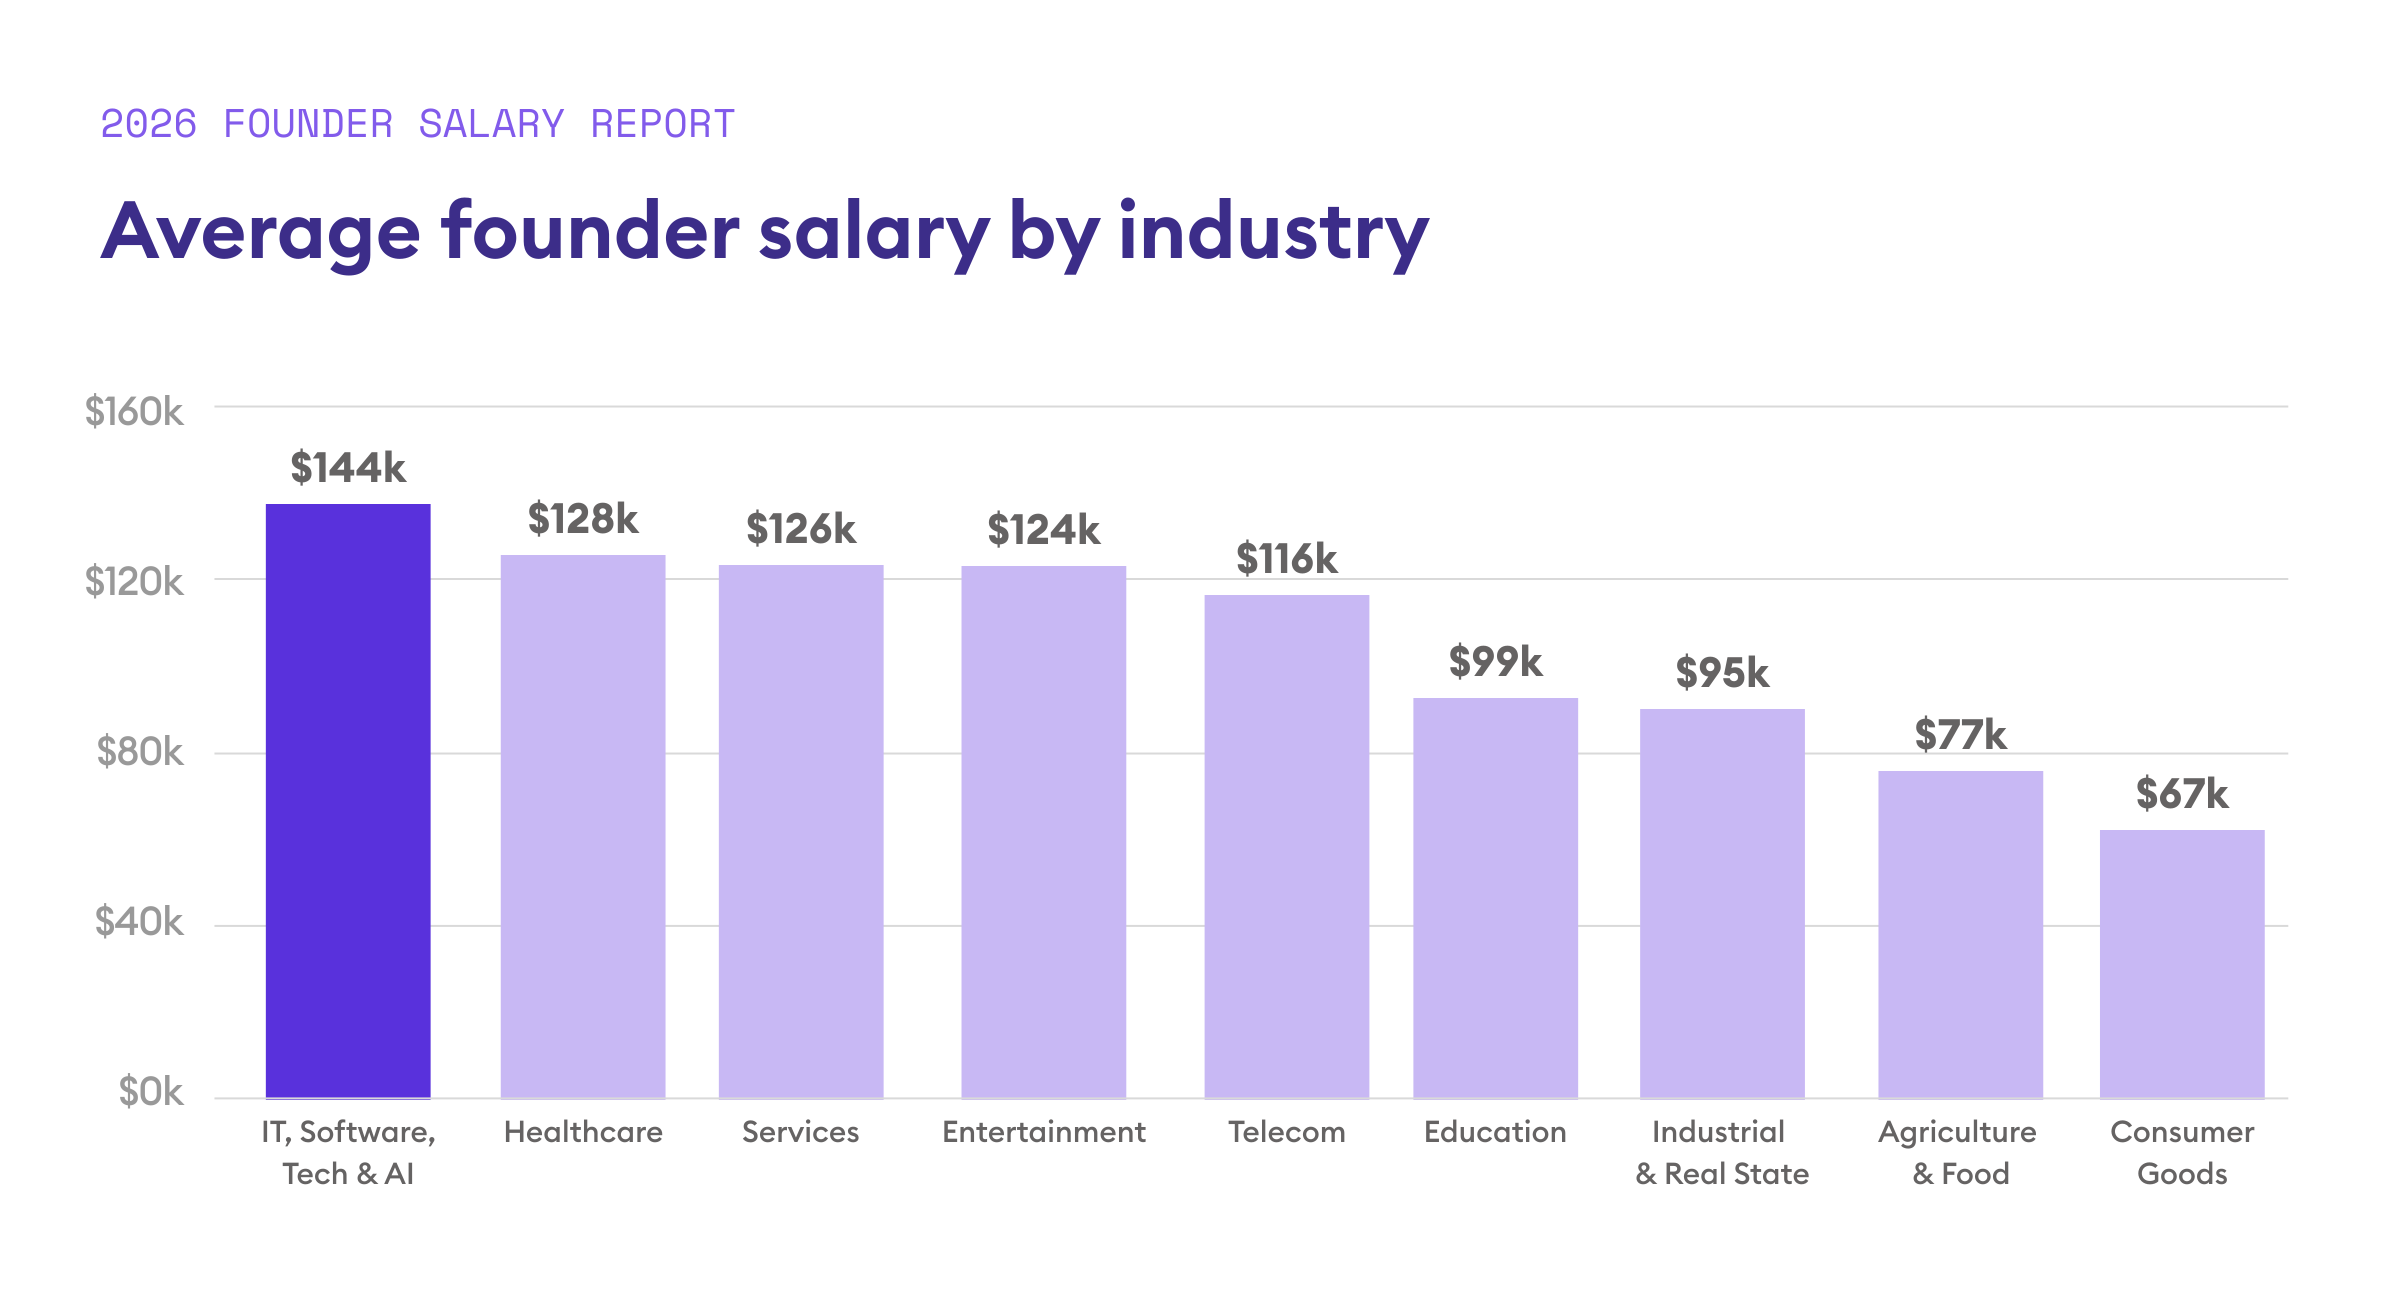
Tech leads salary averages

Your industry shapes your paycheck more than you might expect. Tech founders average $145K, nearly double the $67K average for consumer-goods founders.
Salaries by company phase

Your phase has little to do with salary

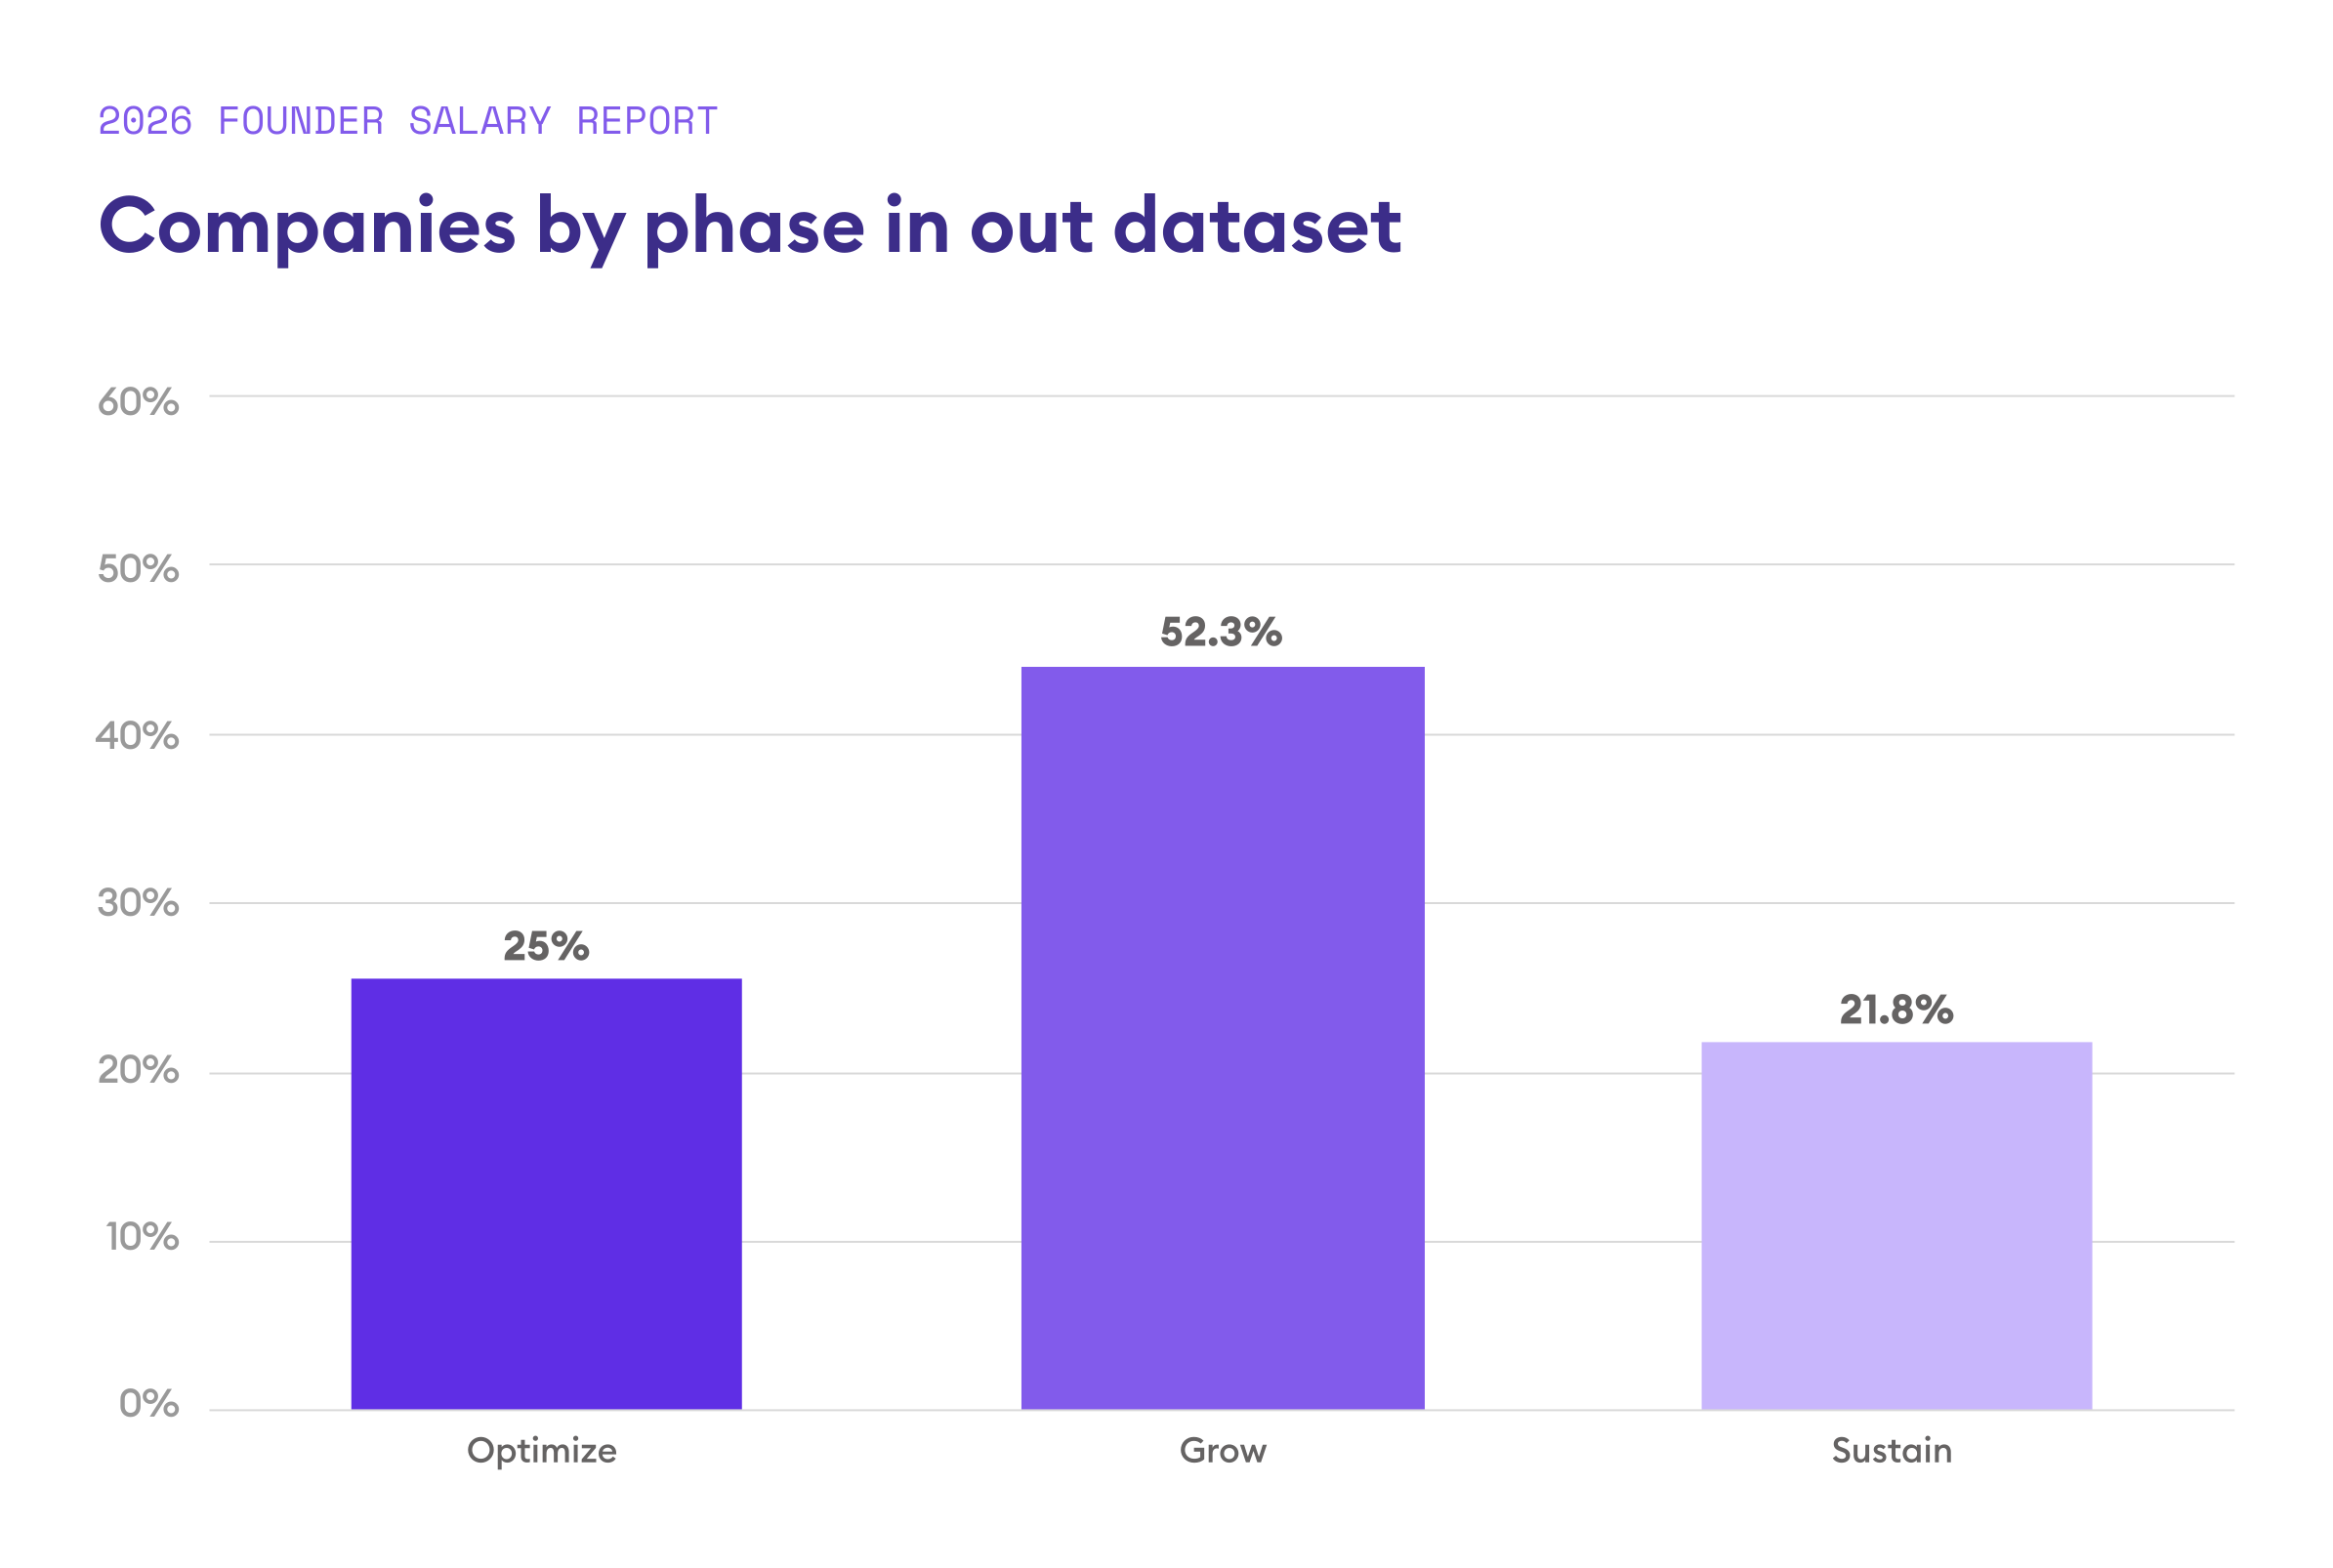
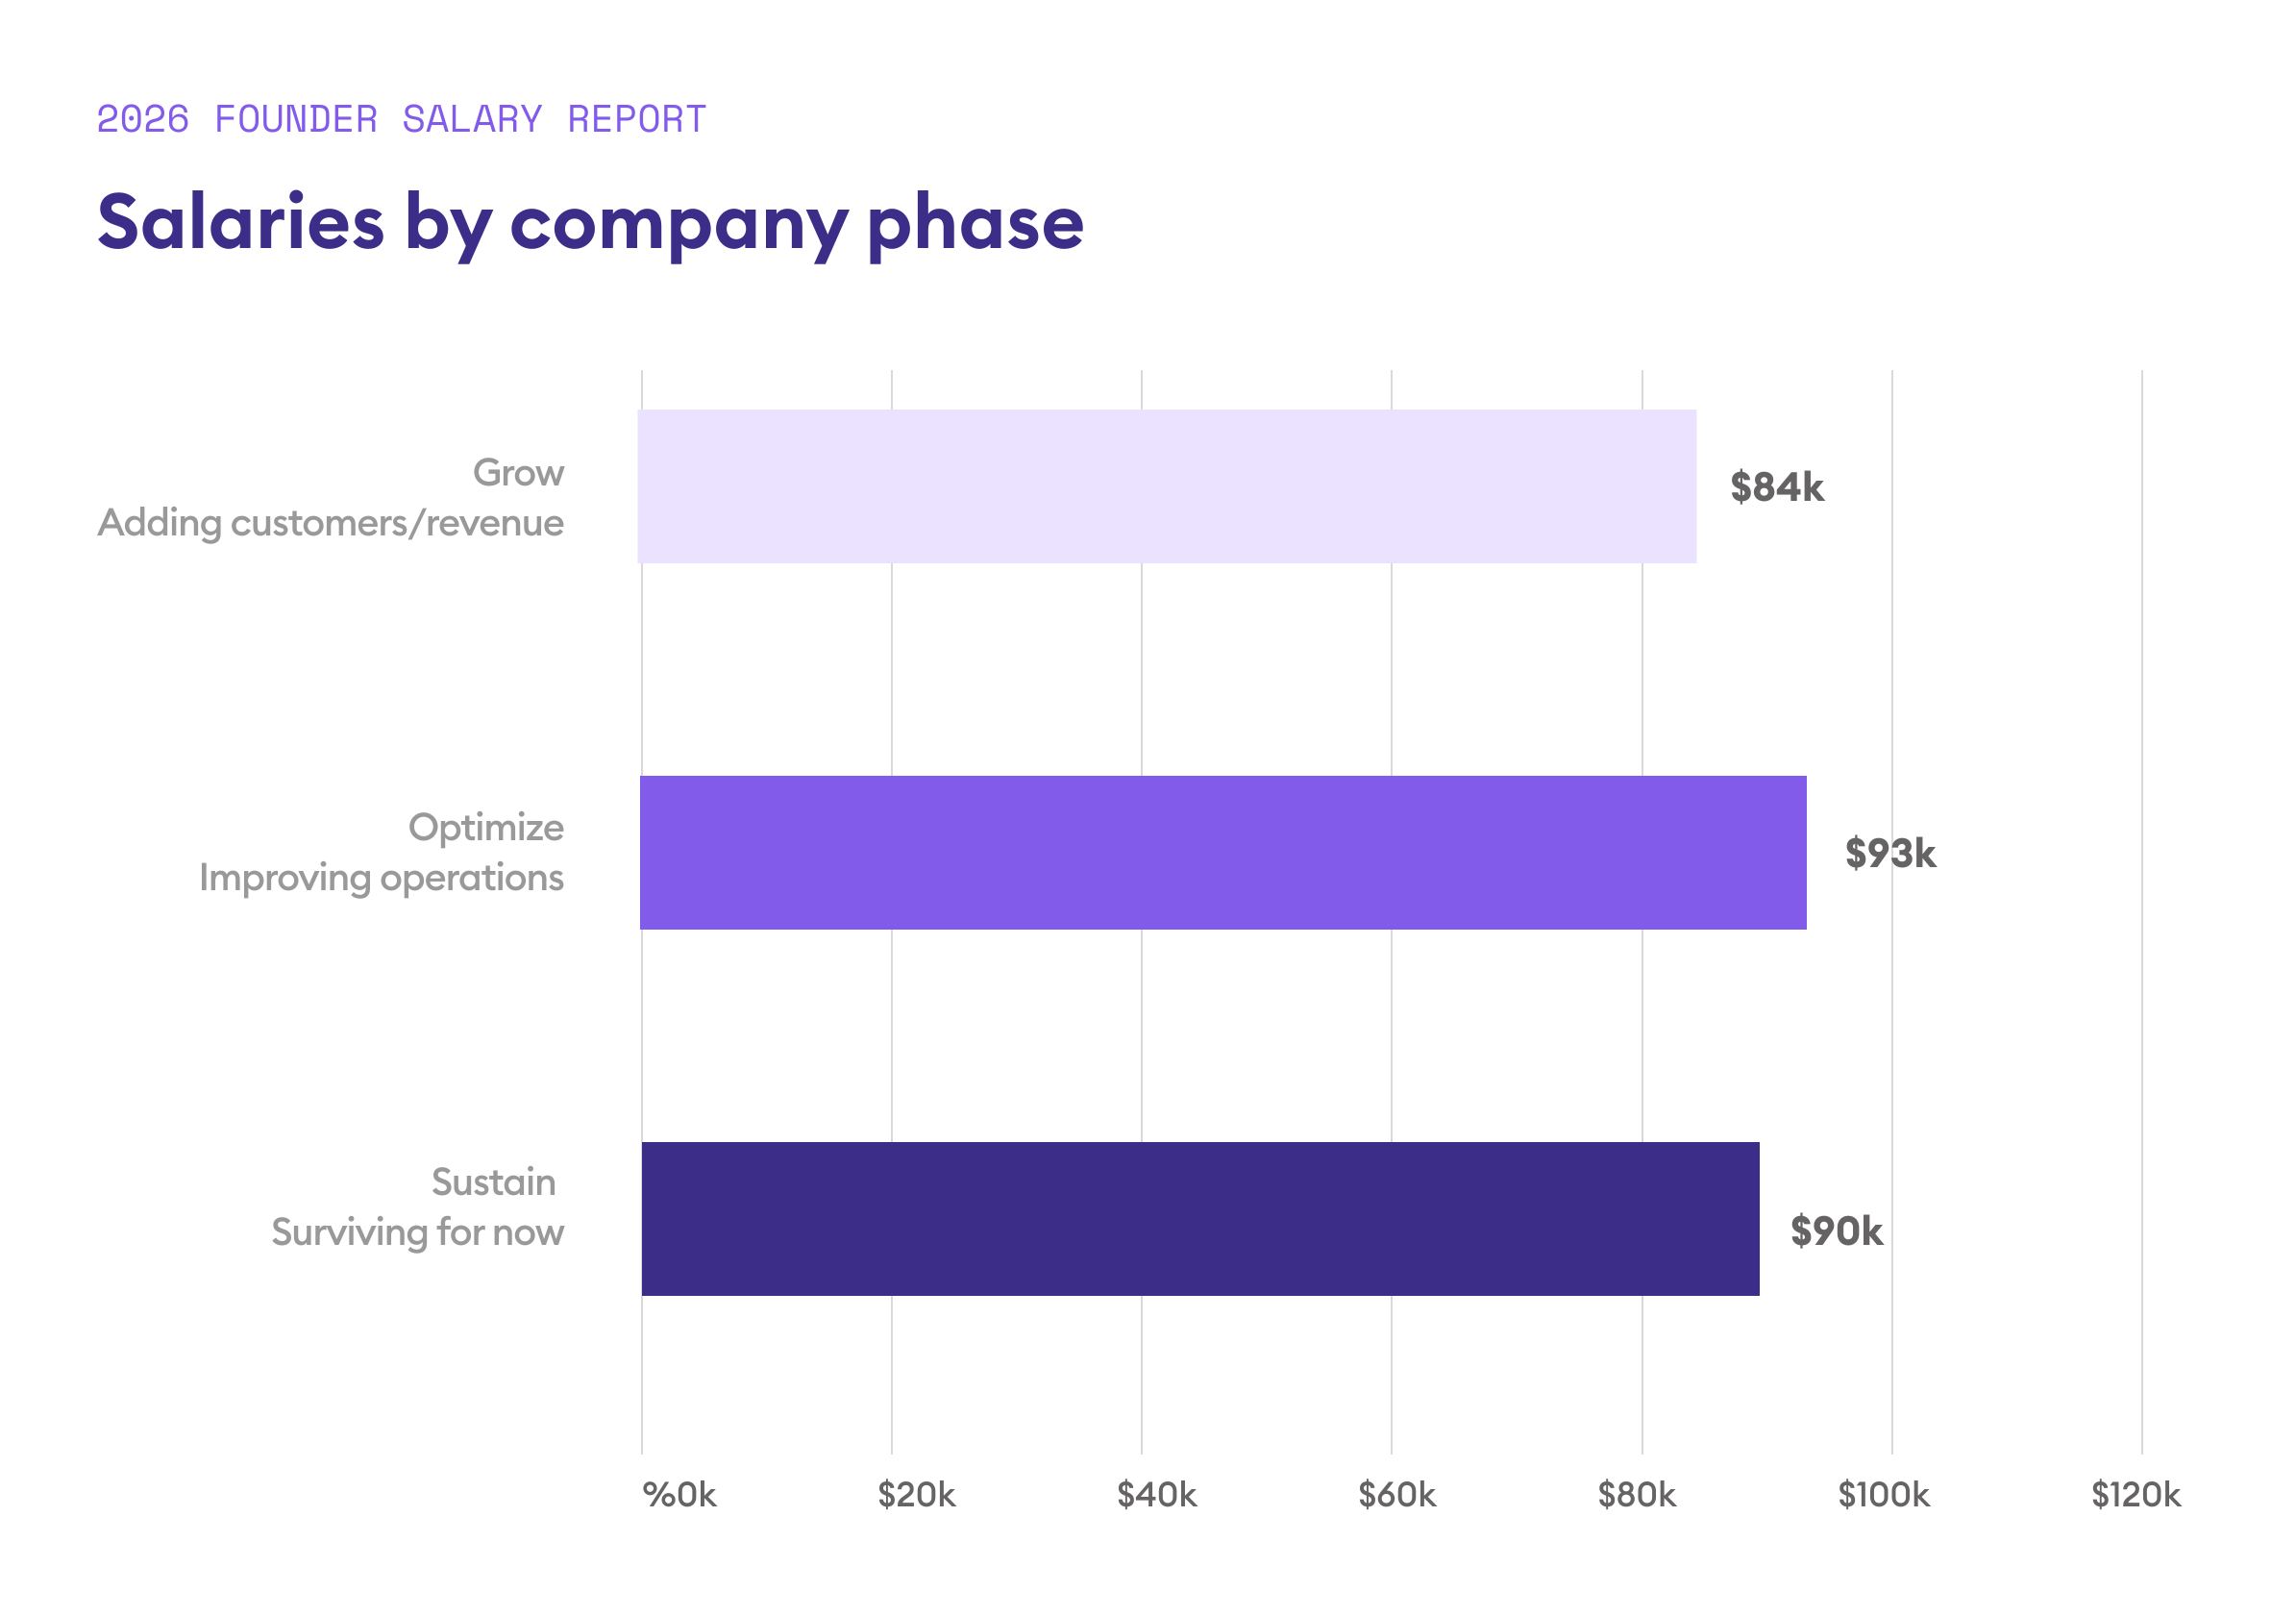
Whether you're growing, optimizing, or just surviving, founder salaries stay consistent, ranging from $80K to $93K on average.
OUR TAKE
Founders deserve to be paid regardless of what phase their company is in. But knowing which financial levers to pull depending on this stage requires real financial clarity and visibility.
Salaries by Geography

Where you are impacts how you’re paid

Founder salaries recovered across every region, but not equally. The Bay Area and Boston saw the biggest gains, up 44% and 45%, respectively, from last year's lows. NYC recovered more modestly, while Texas and the rest of the US also saw smaller boosts.

Median Salaries by Location

US states illustration
$158k
SF Bay Area
$112k
Other US
$145k
Boston Area
$122k
NYC Area
$96k
Texas Area

Average Salaries by location compared to last year

US states illustration
2025
$93K
2026
$135K
Boston Area: ↑45%
2025
$65K
2026
$75K
Other US: ↑15%
2025
$103K
2026
$148K
SF Bay Area: ↑44%
2025
$70K
2026
$75K
Texas Area: ↑8%
2025
$98K
2026
$122K
NYC Area: ↑25%
OUR TAKE
Salary differences across geographies often reflect cost of living more than anything else. Founders should factor this in as they think about their pay.

Breakdown of Salaries by Geography

Lowest Salary
$0
Median Salary
$158k
Highest Salary
$1.3m*
*Likely outliers
Lowest Salary
$0
Median Salary
$122K
Highest Salary
$367K
Lowest Salary
$0
Median Salary
$145K
Highest Salary
$464K
Lowest Salary
$0
Median Salary
$96K
Highest Salary
$414K
Lowest Salary
$0
Median Salary
$112K
Highest Salary
$2m*
Likely outliers
conclusion

Pay yourself what you're worth

The founders who pay themselves well aren't always the ones with the most funding, the highest revenue, or the longest track record. They're the ones who understand their financial position well enough to make a confident decision.

Some founders sacrifice their own livelihood for their business, often out of uncertainty rather than necessity. Many founders don't know what their business can afford, so they take less than they should, or sometimes nothing at all.

That's where Pilot comes in. Our bookkeeping and financial consulting services give founders an accurate, real-time picture of their business, so your paycheck stops being a source of anxiety and becomes a decision you make with confidence.

You've built something real. You deserve to be paid like it.

Book a call with us

Salaries by region

SF Bay Area

Salaries

$0
7%
$1-$49K
5%
$50K-$99K
18%
$100K-$149K
20%
$150K-$199K
25%
$200K-$249K
11%
$250K-$299K
5%
$300K+
9%

Funding

$0-$99K
10%
$100k-$999k
19%
$1M-$2.9M
27%
$3M-$4.9M
13%
$5M–$9.9M
13%
$10M+
19%

Full-Time Employees

0-5 FTEs
22%
6-10 FTEs
20%
11-25 FTEs
26%
26-50 FTEs
10%

Breakdown of Salaries by Funding Level

Lowest Salary
$0
Median Salary
$146K
Highest Salary
$1.3m*
*Likely outliers
Lowest Salary
$0
Median Salary
$103K
Highest Salary
$562K
Lowest Salary
$0
Median Salary
$115K
Highest Salary
$342K
Lowest Salary
$0
Median Salary
$150K
Highest Salary
$243K
Lowest Salary
$0
Median Salary
$172K
Highest Salary
$390K
Lowest Salary
$56K
Median Salary
$188K
Highest Salary
$457K

Breakdown of Salaries by Full-Time Employees

Lowest Salary
$0
Median Salary
$110K
Highest Salary
$567K
Lowest Salary
$0
Median Salary
$118K
Highest Salary
$250K
Lowest Salary
$0
Median Salary
$160K
Highest Salary
$1.3m*
*Likely outliers
Lowest Salary
$0
Median Salary
$161K
Highest Salary
$415K

New York City Area

Salaries

$0
6%
$1-$49K
13%
$50K-$99K
16%
$100K-$149K
33%
$150K-$199K
20%
$200K-$249K
9%
$250K-$299K
1%
$300K+
2%

Funding

$0-$99K
11%
$100k-$999k
28%
$1M-$2.9M
12%
$3M-$4.9M
16%
$5M–$9.9M
17%
$10M+
16%

Full-Time Employees

0-5 FTEs
22%
6-10 FTEs
16%
11-25 FTEs
25%
26-50 FTEs
13%

Breakdown of Salaries by Funding Level

Lowest Salary
$0
Median Salary
$115K
Highest Salary
$367K
Lowest Salary
$0
Median Salary
$109K
Highest Salary
$250k
Lowest Salary
$50K
Median Salary
$117K
Highest Salary
$151K
Lowest Salary
$0
Median Salary
$132K
Highest Salary
$238K
Lowest Salary
$0
Median Salary
$148K
Highest Salary
$245K
Lowest Salary
$44K
Median Salary
$150K
Highest Salary
$318K

Breakdown of Salaries by Full-Time Employees

Lowest Salary
$0
Median Salary
$107K
Highest Salary
$248K
Lowest Salary
$14K
Median Salary
$111K
Highest Salary
$200k
Lowest Salary
$47K
Median Salary
$145K
Highest Salary
$367K
Lowest Salary
$35K
Median Salary
$122K
Highest Salary
$297K

Boston Area

Salaries

$0
6%
$1-$49K
13%
$50K-$99K
17%
$100K-$149K
19%
$150K-$199K
17%
$200K-$249K
17%
$250K-$299K
2%
$300K+
10%

Funding

$0-$99K
22%
$100k-$999k
24%
$1M-$2.9M
13%
$3M-$4.9M
4%
$5M–$9.9M
11%
$10M+
26%

Full-Time Employees

0-5 FTEs
17%
6-10 FTEs
17%
11-25 FTEs
35%
26-50 FTEs
8%

Breakdown of Salaries by Funding Level

Lowest Salary
$0
Median Salary
$50K
Highest Salary
$380K
Lowest Salary
$33K
Median Salary
$97K
Highest Salary
$154K
Lowest Salary
$15K
Median Salary
$181K
Highest Salary
$231K
Lowest Salary
$0
Median Salary
$68K
Highest Salary
$135K
Lowest Salary
$0
Median Salary
$150K
Highest Salary
$214K
Lowest Salary
$85K
Median Salary
$201K
Highest Salary
$464K

Breakdown of Salaries by Full-Time Employees

Lowest Salary
$25K
Median Salary
$93K
Highest Salary
$174K
Lowest Salary
$0
Median Salary
$94K
Highest Salary
$127K
Lowest Salary
$0
Median Salary
$182K
Highest Salary
$380K
Lowest Salary
$154K
Median Salary
$170K
Highest Salary
$200K

Texas Area

Salaries

$0
17%
$1-$49K
16%
$50K-$99K
28%
$100K-$149K
17%
$150K-$199K
12%
$200K-$249K
3%
$250K-$299K
2%
$300K+
6%

Funding

$0-$99K
49%
$100k-$999k
19%
$1M-$2.9M
15%
$3M-$4.9M
6%
$5M–$9.9M
8%
$10M+
3%

Full-Time Employees

0-5 FTEs
36%
6-10 FTEs
13%
11-25 FTEs
21%
26-50 FTEs
15%

Breakdown of Salaries by Funding Level

Lowest Salary
$0
Median Salary
$40K
Highest Salary
$332K
Lowest Salary
$0
Median Salary
$76K
Highest Salary
$311K
Lowest Salary
$0k
Median Salary
$120K
Highest Salary
$199K
Lowest Salary
$89K
Median Salary
$148K
Highest Salary
$208K
Lowest Salary
$25K
Median Salary
$165K
Highest Salary
$408K
Lowest Salary
$150K
Median Salary
$173K
Highest Salary
$414K

Breakdown of Salaries by Full-Time Employees

Lowest Salary
$0
Median Salary
$37K
Highest Salary
$408K
Lowest Salary
$0
Median Salary
$93K
Highest Salary
$247K
Lowest Salary
$0
Median Salary
$91K
Highest Salary
$304K
Lowest Salary
$0
Median Salary
$110K
Highest Salary
$280K

Other U.S

Salaries

$0
9%
$1-$49K
19%
$50K-$99K
31%
$100K-$149K
14%
$150K-$199K
14%
$200K-$249K
4%
$250K-$299K
4%
$300K+
5%

Funding

$0-$99K
42%
$100k-$999k
29%
$1M-$2.9M
12%
$3M-$4.9M
5%
$5M–$9.9M
6%
$10M+
7%

Full-Time Employees

0-5 FTEs
37%
6-10 FTEs
19%
11-25 FTEs
20%
26-50 FTEs
10%

Breakdown of Salaries by Funding Level

Lowest Salary
$0
Median Salary
$50k
Highest Salary
$883K
Lowest Salary
$0
Median Salary
$75K
Highest Salary
$2m*
*Likely outliers
Lowest Salary
$0k
Median Salary
$132K
Highest Salary
$1m*
*Likely outliers
Lowest Salary
$0
Median Salary
$150K
Highest Salary
$266K
Lowest Salary
$0
Median Salary
$150K
Highest Salary
$1.8m*
*Likely outliers
Lowest Salary
$0
Median Salary
$183K
Highest Salary
$526K

Breakdown of Salaries by Full-Time Employees

Lowest Salary
$0
Median Salary
$50K
Highest Salary
$1m*
*Likely outliers
Lowest Salary
$0
Median Salary
$82K
Highest Salary
$1m*
*Likely outliers
Lowest Salary
$0
Median Salary
$120K
Highest Salary
$2m*
*Likely outliers
Lowest Salary
$0
Median Salary
$124K
Highest Salary
$825K
Methodology
The 2026 Pilot Founder Salary Report is based on survey responses from 1,623 founders collected in early 2026. Data was gathered from three sources: a paid survey panel (Centiment), organic respondents, and Pilot's own product user base.

Salary figures reflect annual cash compensation only and exclude stock-based compensation. Respondents were asked to enter $0 if they take no salary.

Free-text responses for company type were standardized from 511 unique entries into 12 categories. Outliers were removed from salary, funding, and revenue data using an interquartile range method, with any values exceeding 10x the IQR flagged and excluded.

Geographic data was verified against IP addresses where possible. Respondents were categorized into five regions: SF Bay Area, NYC Area, Boston Area, Texas Area, and Other US.

Unless otherwise noted, all salary figures reflect averages. Median figures are included in select sections for additional context. Statistical significance was assessed using linear regression models with a p-value threshold of p < 0.05. R² values are reported where relevant to indicate practical explanatory power.

Some variables—including company phase, founder age, and salary determination method—were only available for a subset of respondents, as the Pilot product dataset did not include these fields. Sample sizes are noted throughout.

Data from the geographic breakdowns and several cross-tabulations in this report were derived from the raw homogenized dataset and have not been independently verified by a third-party analyst.

Share the report

Subscribe for business tips, tax updates, financial fundamentals and more.